Which works best, strategies comparing past returns among assets (relative or cross-sectional) or strategies requiring positive past raw/excess returns (intrinsic or absolute or time series)? In their May 2015 paper entitled “Cross-Sectional and Time-Series Tests of Return Predictability: What is the Difference?”, Amit Goyal and Narasimhan Jegadeesh investigate differences between relative and intrinsic past return strategies, focusing on individual U.S. common stocks. For relative return strategies, they construct portfolios that are long (short) stocks with above-average (below-average) past returns, with the long and short sides weighted equally. For intrinsic return strategies, they construct portfolios that are long (short) stocks with past returns greater (less) than the risk-free rate, with each stock weighted equally. They consider past return measurement (ranking) intervals and holding intervals each ranging from one month to 60 months. They also compare relative and intrinsic past return strategies across and within global asset classes (17 equity indexes, 21 bond indexes, 24 commodity spot series and 8 currencies). Finally, they apply the relative and intrinsic concepts to individual U.S. stock financial ratios (book/market, gross profit/assets, asset growth and accruals/assets), with relative comparing once a year to the average for all stocks and intrinsic comparing once a year stock-by-stock to respective median values over the past five years. Using data for a broad sample of U.S. common stocks above the 20th percentile of NYSE market capitalization during 1946 through 2013, and for the asset class series during 1985 through 2013, they find that:
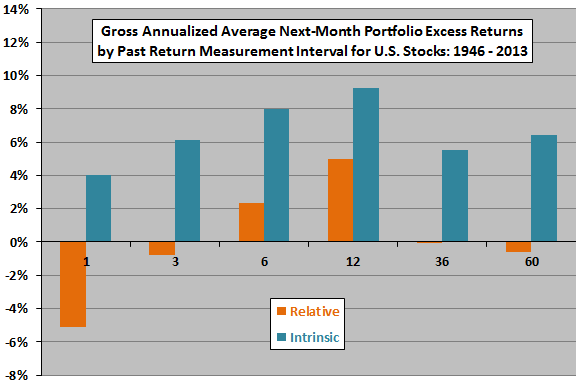
- The relative and intrinsic past return strategies as applied to individual U.S. stocks perform differently (see the first chart below).
- The relative (intrinsic) strategy based on a one-month ranking interval and one-month holding interval generates an average gross annualized excess return of -5.1% (+4.0%).
- The relative (intrinsic) strategy based on a six-month ranking interval and one-month holding interval generates an average gross annualized excess return of +2.3% (+8.0%).
- During January, all relative past return strategies and those intrinsic past return strategies with ranking intervals of 12 months or shorter produce negative average excess returns.
- Differences in performance between relative and intrinsic past return portfolios derive from the facts that the latter is: (1) net long on average; and, (2) more net long after strong than weak market conditions. Constraining the intrinsic strategy portfolio to equal long and short sides suppresses differences. In other words, the relative and intrinsic past return strategies are about equally effective in identifying future winner and loser stocks.
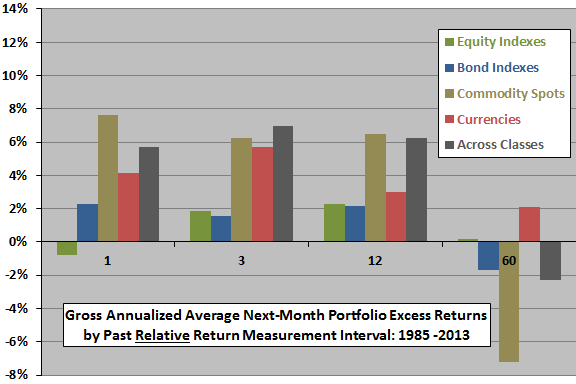
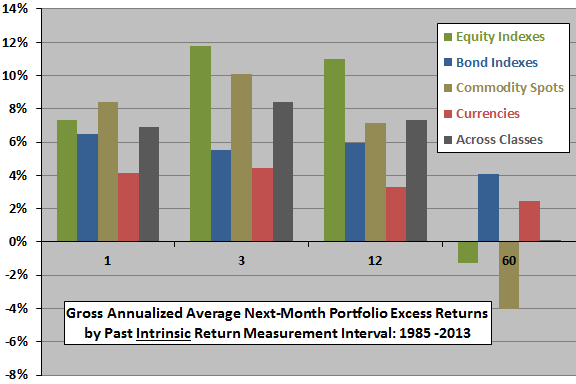
- Similarly, the relative and intrinsic past return strategies applied across and within asset classes perform differently (see the second and third charts below).
- Applied across all asset classes, a one-month holding interval is optimal, suggesting that momentum is more fleeting for asset classes than individual stocks.
- As for individual U.S. stocks, differences between relative and intrinsic strategies derive from the average net long position of intrinsic portfolios and variation over time in the degree that they are net long. In other words, the relative and intrinsic past return strategies are about equally effective in identifying future winner and loser assets.
- For U.S. stock financial ratios:
- The relative book/market strategy is more effective at identifying value and growth stocks than the intrinsic strategy.
- The intrinsic profit/assets strategy is more effective at identifying stocks responsive to profitability than the relative strategy.
- The relative asset growth strategy is more effective at identifying stocks responsive to this variable than the intrinsic strategy.
- The relative and intrinsic accruals/assets strategies perform about equally in identifying stocks responsive to this variable.
The following chart, constructed from data in the paper, compares gross annualized average next-month excess returns (above the risk-free rate) for the relative and intrinsic past return portfolios of individual U.S. stocks, as specified above, during 1946-2013. The horizontal axis indicates past return ranking intervals (in months). The holding interval is one month in all cases (monthly portfolio reformation). Relative portfolios are each month reset to have equal long and short sides. Intrinsic portfolios may be net long or net short depending on the distribution of past returns during the ranking interval.
Intrinsic portfolios consistently outperform their relative counterparts. However, this outperformance is due to the average and time-varying net “longness” of the intrinsic portfolios. It is not due to superior ability to identify future winners and losers.
The next two charts, also constructed from data in the paper, compares gross annualized average next-month excess return (above the risk-free rate) for relative (upper chart) and intrinsic (lower chart) past return portfolios across and within four global asset classes, as specified above, during 1985-2013. The horizontal axes indicate past return ranking intervals (in months). The holding interval is one month in all cases (monthly portfolio reformation). Relative portfolios are each month reset to have equal long and short sides. Intrinsic portfolios may be net long or net short depending on the distribution of past returns during the ranking interval.
Again, in general, intrinsic portfolios outperform their relative counterparts. However, this outperformance is due to the average and time-varying net “longness” of the intrinsic portfolios. It is not due to superior ability to identify future winners and losers.
In summary, evidence offers little support for belief that intrinsic momentum is better or worse than relative momentum for identifying future winners and losers, whether applied to individual stocks, or across or within major asset classes.
Cautions regarding findings include:
- Most analyses compare outcomes that are not comparable on a committed capital basis (equal long and short for relative versus average net long for intrinsic).
- Reported performance data is gross, not net.
- Including costs of rebalancing and turnover would reduce returns. Accounting for shorting costs would further reduce returns, and shorting may not always be feasible.
- Use of indexes for asset classes ignores costs of maintaining tracking funds. Such costs would reduce returns.
- Commodity spot returns ignore costs of storage as applicable.
- Findings based on performance net of all these costs may differ from gross findings.
- Commodity spot returns differ materially from commodity futures returns because the latter incorporate expectations for future spot prices.
- The intrinsic strategy applied to firm financial ratios is different from that applied to past returns.