What is the best stock pairs trading method? In their June 2015 paper entitled “The Profitability of Pairs Trading Strategies: Distance, Cointegration, and Copula Methods”, Hossein Rad, Rand Kwong Yew Low and Robert Faff compare performances of three pairs trading methods as applied to U.S. stocks.
- Distance – Select the 20 stock pairs with the smallest sum of squared differences in initially normalized dividend-adjusted prices during a 12-month formation period. Then re-normalize prices of selected pairs and initiate equal long-short trades when prices diverge by at least two formation-period standard deviations during a subsequent six-month trading period. Close trades when prices converge or, if not, at the end of the trading period. Re-open trades if prices diverge again withing the trading period.
- Cointegration – Sort stock pairs based on sum of squared differences in initially normalized dividend-adjusted prices during a 12-month formation period. Then determine which pairs are cointegrated (exhibit a reliable mean-reverting relationship) during the formation period, and select the 20 cointegrated pairs with the smallest sum of squared differences. Over the subsequent six-month trading period, trade pair divergences and convergences based on cointegration statistics, with long and short position sizes also determined by these statistics.
- Copula – Select the 20 stock pairs with the smallest sum of squared differences in initially normalized dividend-adjusted prices during a 12-month formation period. Then construct best-fit copulas for each pair and use copula statistics to determine when pair prices diverge and converge during a subsequent six-month trading period, opening and closing equal long-short trades accordingly.
They iterate each method monthly, so each always involves six overlapping portfolios. They assume round trip broker fees start at 0.7% in 1962 and gradually decline to 0.09% in recent years. They estimate impact of trading on price as 0.3% during 1962-1988 and 0.2% since. They assume zero cost of shorting. They calculate returns based on both employed capital (funding only actual trades) and committed capital (funding 20 concurrent positions per portfolio, with no return on cash). Monthly return for each method is the equally weighted average for the six overlapping portfolios. Using daily dividend-adjusted prices for a broad sample of relatively liquid U.S. common stocks during 1962 through 2014, they find that:
- The distance and cointegration methods perform similarly, both beating the copula method. Specifically, based on employed capital:
- The distance, cointegration and copula methods generate average monthly gross (net) returns of 0.88%, 0.83% and 0.43% (0.36%, 0.33% and 0.05%), respectively.
- Corresponding net monthly Sharpe ratios are 0.33, 0.34 and 0.08.
- Corresponding maximum net drawdowns are -12%, -17% and -20%,
- Using committed capital generally lowers returns, but net Sharpe ratios are similar.
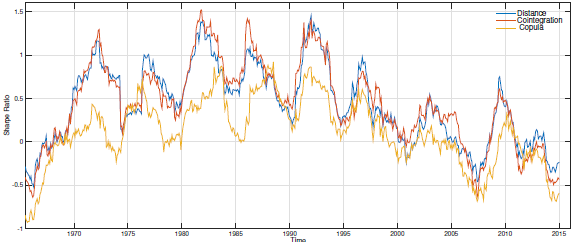
- Pairs trading performance peaks about 1990 and mostly declines thereafter to recently unattractive levels (see the chart below).
- For all three methods, trades that do not close before the end of the trading period have negative average returns. These trades make return distribution left tails fatter than right tails (extreme negative returns more likely than extreme positive returns). The distance (copula) method has the lowest (highest) proportion of open trades at trading period ends.
- The numbers of distance and cointegration trading opportunities decline substantially in recent years, by 40% and 35%, respectively, from 2007-2011 to 2012-2014. Copula trading opportunities decline only 15% across these subsamples.
- Returns for all three methods relate negatively to market liquidity, and all (especially cointegration) perform better during the worst 20% of years for the U.S. stock market than during the other 80%.
- All three methods have significantly positive alphas over the entire sample period after accounting for various risk factors.
The following chart, taken from the paper, shows 24-month moving average monthly net Sharpe ratios for the three pairs trading methods based on employed capital. Performances trend upward until about 1990, and trend downward thereafter (and are unattractive since about 2000). Relative underperformance of the copula method generally decreases over time. In very recent years, the three methods perform similarly. A possible explanation is that falling trading frictions have increased competition for pairs trading, but less so for the most complex method.
In summary, evidence indicates that the simple distance U.S. stock pairs trading method is competitive with more complex methods (but not optimal during bear markets), and that pairs trading may no longer be attractive.
Cautions regarding findings include:
- Testing different methods on the same data introduces snooping bias, such that the best-performing method tends to overstate expectations. There may also be snooping bias within each method according to the number of parameters the tester must specify. In general, more complex methods have more parameters and therefore the greatest potential for snooping.
- Some investors may bear trading/shorting frictions higher than the assumed levels, pressuring performance downward. Some stocks may not be available for shorting (or for zero-cost shorting) at any point in time.
- The cointegration and copula methods are likely beyond the reach of most investors, who would bear fees for delegating execution to investment managers.
- Timely data acquisition/processing may be problematic early in the sample period. Earlier availability of modern capabilities may have suppressed pairs trading performance.