What qualifiers can enhance the performance of a small value stock strategy? In their August 2015 paper entitled “Leveraged Small Value Equities”, Brian Chingono and Daniel Rasmussen devise and test a strategy to refine a portfolio of small capitalization value stocks of firms that with relatively high financial leverage. Specifically, their target universe at the end of each year consists of all NYSE/AMEX/NASDAQ stocks with: (1) market capitalizations between the 25th and 75th percentiles; (2) among the 25% of cheapest stocks based on EBITDA divided by enterprise value; and, (3) above median long term debt divided by enterprise value. They then rank the stocks in this universe per a group of quality and technical factors that emphasize reduction in long-term debt and improving asset turnover (revenue growth rate greater than asset growth rate). At the end of the first quarter of each following year, they reform portfolios of the top 25 and top 50 stocks in the specified universe based on this ranking. Using stock return and accounting data for a broad sample of U.S. stocks during January 1963 through December 2014, they find that:
- The universe of small value stocks of leveraged firms outperforms the broad U.S. stock market by an average 1.9% per year. For 2013, there are 343 stocks in the universe.
- Stocks of firms in this universe that are paying down long-term debt, the strongest ranking variable, outperform those that are not by an average 3.6% annually.
- Over the entire sample period, the value-weighted top 25 (top 50) portfolio as specified above has (see the charts below):
- Gross average annual return 25.1% (23.0%).
- Standard deviation of annual returns 39.4% (40.0%).
- Gross annual Sharpe ratio 0.51 (0.45).
- Gross annual five-factor (market, size, book-to-market, momentum, liquidity) alpha 13.1% (10.9%).
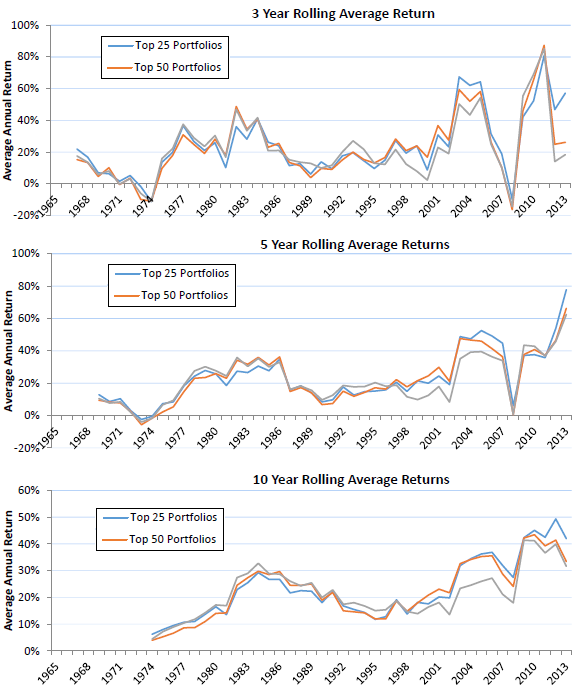
The following charts, taken from the paper, track rolling 3-year, 5-year and 10-year gross returns for the top 25 and top 50 portfolios as specified above. Results confirm that the portfolios perform well over long horizons but are very volatile at short horizons.
In summary, evidence indicates that screen for firms with high leverage but declining debt enhances average return of a small-value investment strategy.
Cautions regarding findings include:
- Reported performance statistics are gross, not net. Accounting for costs of annual portfolio reformation would modestly reduce performance.
- The paper does not specify the stock ranking system in detail. It may involve data snooping bias (optimization via experimentation).
- There appears to be look-ahead bias in specifications of the universe and the ranking system used to pick stocks from the universe.
- The universe specification relies partly on past research on size and value factors based on similar and certainly overlapping stock samples.
- The authors use the stock universe over the entire sample period to develop the ranking system. This approach injects knowledge of future variable-stock return relationships into the selection of each year’s portfolio. Such an approach may overstate expected strategy performance substantially.
- The study does not test robustness (luckiness) of the cutoffs used to specify the stock universe.