Is there a way to predict when beta anomaly arbitrage (long low-beta stocks and short high-beta stocks will work? In the August 2015 version of their paper entitled “The Booms and Busts of Beta Arbitrage”, Shiyang Huang, Dong Lou and Christopher Polk investigate the power of a metric that measures beta arbitrage activity to predict associated returns. They measure beta via regressions of daily stock returns over the past 12 months versus daily market returns (contemporaneous and five lags to smooth unrelated effects). Each month, they rank stocks by beta and reform a hedge portfolio that is long (short) the value-weighted tenth, or decile, of stocks in the lowest (highest) betas. They measure beta arbitrage activity as the average pairwise correlation of weekly three-factor alphas (adjusting for market, size and book-to-market factors) of stocks in the lowest beta decile over the past 52 weeks. They then measure average hedge portfolio alphas for different ranges (ranked fifths, or quintiles) of beta arbitrage activity by month over long holding intervals. Using daily returns and other data for a broad sample of U.S. common stocks during 1970 through 2010, they find that:
- The specified measure of beta arbitrage activity generally agrees with those based on institutional and hedge fund holdings, but appears to capture additional information.
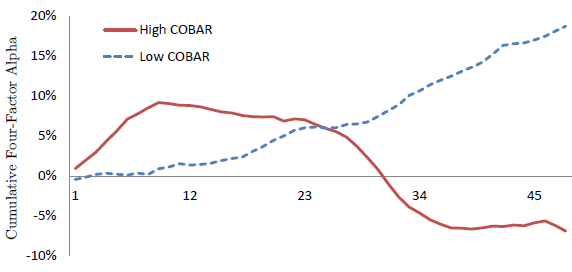
- When beta arbitrage activity is low (bottom 20% of values):
- Beta hedge portfolio alpha takes two or three years to develop.
- However, during the third year, average gross monthly alpha is 0.85%.
- When beta arbitrage activity is high (top 20% of values):
- Beta hedge portfolio alpha develops quickly. During the first six months, average gross monthly alpha is 1.56%.
- However, strategy alpha overshoots and then reverts, perhaps due to strategy crowding. Reversion is strongest during the third year, with average gross monthly alpha -0.74%.
- Adding the momentum factor to alpha calculations has little effect on beta hedge portfolio alpha (see the chart below).
- Variation of beta arbitrage strategy performance is particularly strong for stocks of firms with high financial leverage.
- Results are robust to use of monthly returns and to other beta calculation intervals.
The following chart, taken from the paper, tracks four-factor alpha (adjusting for market, size, book-to-market and momentum factors) for the beta hedge portfolio during the 20% of observations with the highest (red line) and lowest (dashed blue line) beta arbitrage activity (termed COBAR in the paper). When beta arbitrage activity is low, alpha is slow to develop, is strongest during year three and does not revert. When beta arbitrage activity is high, alpha is quick to develop but apparently overshoots, resulting in reversion that is particularly strong in year three.
In summary, evidence indicates that portfolios that are long low-beta stocks and short high-beta stocks tend to have strong (weak) near-term performance when measurable beta arbitrage activity is relatively high (low).
Cautions regarding findings include:
- Reported alphas are gross, not net. Accounting for monthly trading frictions and continuous shorting costs would lower alphas. Moreover:
- Trading frictions and shorting costs may vary with level of arbitrage activity, thereby affecting findings.
- Shorting may not be feasible for some stocks that are very difficult to borrow.
- Most investors would have to delegate portfolio management, and thereby bear fees that reduce alpha.
- Variation in beta arbitrage strategy alphas is not systematic across arbitrage activity quintiles, suggesting tail effects rather than a consistent relationship.
- Test measurements are fairly complex, suggesting potential for data snooping bias in tested parameter settings.