Which measure of past firm profitability is most effective for forming U.S. stock and equity sector portfolios? In their October 2015 paper entitled “Portfolio Allocations Using Fundamental Ratios: Are Profitability Measures Effective in Selecting Firms and Sectors?”, John Hughen and Jack Strauss examine portfolio strategies based on four sector and firm profitability measures: gross profit, operating profit, EBITDA and an average (composite) of the three variables. They compare these portfolios to a buy-and-hold portfolio (S&P 500 Index stocks with equal sector weights) and portfolios form on cash flow, net income and book-to-market ratio. Their rankings of sectors and individual stocks include lags to ensure public availability of profit measures. Using quarterly returns and accounting data for S&P 500 Index stocks and ten associated sectors during January 1975 through April 2014 (with out-of-sample tests commencing January 1980), they find that:
- Over the out-of-sample test period, the specified buy-and-hold benchmark has gross average quarterly return 3.3% and gross annualized Sharpe ratio 0.59, compared to 3.2%and 0.52 for the value-weighted S&P 500 Index.
- Portfolios reformed quarterly from the top fifth (quintile) of sectors and the top quintile of stocks within each of those sectors beat the buy-and-hold benchmark by more than 5% per year gross for all measures except book-to-market ratio (see the chart below). Portfolios formed on operating profit and gross profit perform best, beating the benchmark by 8.8% and 9.2% per year, respectively, with gross annualized Sharpe ratios 0.81 and 0.73.
- Portfolios reformed quarterly from the bottom quintile of sectors and the bottom quintile of stocks within each of those sectors generally perform poorly, most notably for EBITDA and composite profitability.
- 150/50 long/short portfolios exploiting differences in performance based on profitability measures, reformed quarterly, generally outperform the buy-and-hold benchmark, most strongly for EBITDA and composite profitability with, respectively, gross annualized Sharpe ratios 0.91 and 0.95 and gross annualized three-factor (market, size, book-to-market) alphas 14.1% and 14.2%.
- Portfolios based on profitability outperform the buy-and-hold benchmark during about two-thirds of quarters and over each of the last three decades, as well as during and after the financial crisis.
- Separately, based on long-only top quintile portfolios:
- Stock-level sorts generate terminal wealths three to six times larger than those from sector-level sorts.
- EBITDA (relatively insensitive to financial leverage and capital intensity) works best for sectors, and composite profitability works best for individual stocks.
- In general, the specified profitability measures work better than net income and cash flow as predictors of sustainable firm performance. In fact, gross profitability and EBITDA are better predictors of future cash flow than either net income or cash flow.
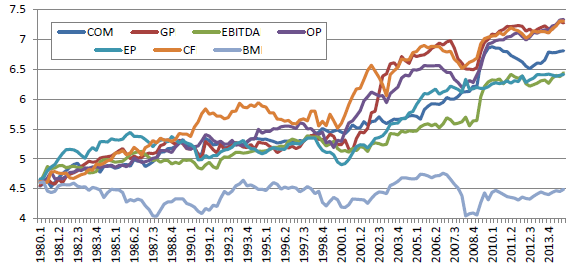
The following chart, taken from the paper, tracks logarithms of gross cumulative values of equal initial investments in portfolios of the top quintile of stocks within each of the top quintile of sectors, reformed quarterly based on the following per-share metrics over the out-of-sample test period:
- GP – gross profit.
- EBITDA
- OP – operating profit.
- COM – the average of GP, EBITDA and OP.
- EP – net income.
- CF – cash flow.
- BM – book-to-market ratio.
Results indicate that profitability measures generally work better than book-to-market ratio. Cash flow is arguably most attractive overall. As stated above, results for long-short portfolios differ.
In summary, evidence indicates that profitability measures effectively identify relatively strong individual U.S. stocks and sectors.
Cautions regarding findings include:
- Results are gross, not net. Even the “buy-and-hold” benchmark requires rebalancing to equal sector weights. Quarterly rebalancing frictions (including maintenance of sector tracking funds) and any shorting costs would reduce performance.
- Testing many indicators on the same data introduces snooping bias, thereby overstating (understating) expectations for the best-performing (worst-performing) indicator. Also, construction of long-short portfolios is complex enough to invite parameter value snooping.