Is selling market index call options to finance, at least partly, buying crash protection in the form of put options a shrewd tactic? In their December 2016 paper entitled “Risk and Return of Equity Index Collars”, Roni Israelov and Matthew Klein investigate the performance of such equity index collars by decomposing their returns into equity risk premium and volatility risk premium components. They treat the CBOE S&P 500 95-110 Collar Index (CLL) that buys three-month put options about 5% out-of-the-money and sells one-month call options about 10% out-of-the-money as representative of equity index collars. They consider four alternatives to CLL (normalized via leverage to provide the same compound return as CLL):
- Reduce equity exposure with cash.
- Buy put options per CBOE S&P 500 5% Put Protection Index (PPUT).
- Sell covered calls per CBOE S&P 500 BuyWrite Index (BXM).
- Sell covered calls and adjust the equity index position to maintain a constant equity exposure (hedged covered calls).
Using monthly returns for the S&P 500 Index, CLL, PPUT and BXM as available (starting July 1986 or March 1996) through December 2014, they find that:
- Since July 1986, the S&P 500 Index (CLL) generates average gross annualized return in excess of cash 7.3% (3.2%), with annual volatility 15.7% (10.7%) and gross annual Sharpe ratio 0.47 (0.30).
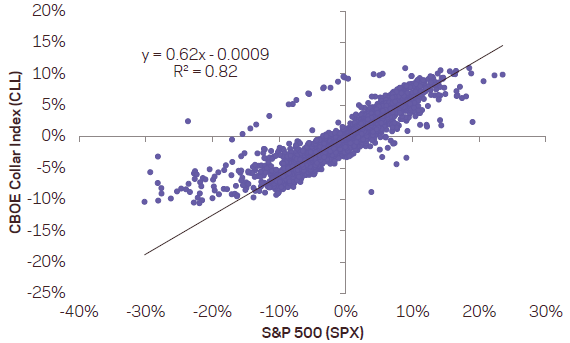
- Based on monthly returns, CLL has beta 0.62, indicating that it captures 38% less equity risk premium than the S&P 500 Index (see the chart below).
- Based solely on its equity risk premium capture rate, CLL would have average gross annualized excess return 4.5%. Its actual return of 3.2% implies annualized loss 1.3% to the volatility risk premium (because put options purchased carry a higher volatility risk premium than call options sold).
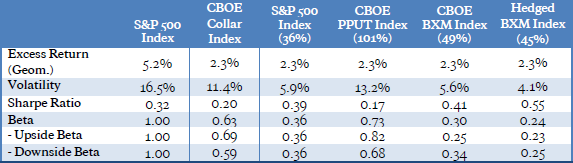
- CLL performs poorly on a gross basis compared to three of the above four alternative risk mitigation strategies (see the table below).
- Black swans would have to be unreasonably frequent to make CLL competitive with the S&P 500 Index (one black swan event every 6.6 years to match the index return).
The following chart, taken from the paper, relates gross CLL returns to same-interval S&P 500 Index returns for overlapping 21-day intervals during July 1986 through December 2014. CLL beta relative to the index is 0.62, with negative alpha. Variation in S&P 500 Index returns explains 82% of the variation in coincident CLL returns.
The following table, also from the paper, summarizes performance statistics (in excess of cash) for the S&P 500 Index, CLL and the four normalized alternative risk mitigation strategies outlined above during March 1996 through December 2014. Based on Sharpe ratio, three of the four alternatives outperform CLL.
In summary, evidence indicates that a typical equity index collar is not optimal as a risk mitigation strategy essentially because of the volatility risk premium it pays.
Cautions regarding findings include:
- Analyses ignore trading frictions involved in monthly portfolio reformation, which may vary materially by strategy. Net findings could differ from gross findings.
- In general, use of indexes rather than tradable assets ignores the costs of creating and maintaining liquid tracking funds, including management fees.
See also “Simple Stock Index Option Strategies”, “Collaring a Broad Equity ETF for Stable Returns?” and “Passive and Active Collar Strategies for ETFs and Mutual Funds”.