Is outperformance of low-volatility stocks just a manifestation of the value premium (outperformance of stocks with high book-to-market ratios compared to stocks with low book-to-market ratios)? In his February 2016 paper entitled “The Value of Low Volatility”, David Blitz examines the interaction of the value premium with returns of long-only portfolios of low-volatility U.S. stocks over various sample periods. His low-volatility portfolios consist of the 30% of stocks with the lowest standard deviations of monthly total returns during the preceding 36 months, reformed monthly. He considers large and small stocks separately, delineated by median NYSE market capitalization, either value-weighted or equal-weighted. Using monthly data for a broad sample of U.S. stocks and the value premium during 1926 through 2014, he finds that:
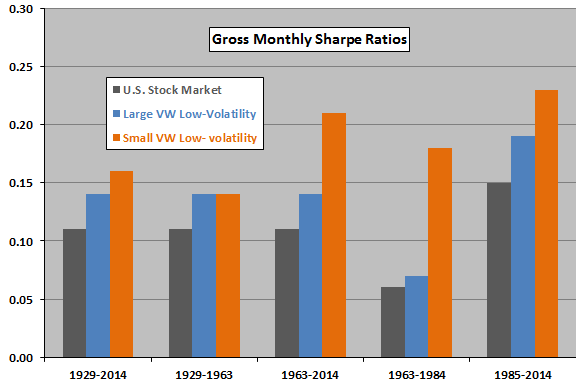
- Based on gross Sharpe ratio, low-volatility portfolios consistently outperform the broad U.S. stock market over the entire sample period and all subperiods (see the chart below).
- The value premium explains low-volatility outperformance only for large capitalization portfolios during 1963-1984. Specifically:
- Over the entire 1929-2014 test period, three-factor (market, size, book-to-market) alphas for low-volatility portfolios are highly significant. Value premium dependence is low (substantial) for large (small) capitalization portfolios.
- During the 1929-1963 subperiod, dependence of low-volatility portfolio performance on the value premium is subdued.
- During the 1963-2014 subperiod, dependence of low-volatility portfolio performance on the value premium is elevated to an extent that three-factor alphas for large-capitalization low-volatility portfolios are weak. However:
- The weak alphas of large-capitalization low-volatility portfolios concentrate during 1963-1984.
- Small-capitalization low-volatility portfolio alphas remain strong (though lower) during 1963-2014.
The following chart, constructed from data in the paper, summarizes gross monthly Sharpe ratios over various sample periods for value-weighted (VW) low-volatility portfolios as specified above. Gross Sharpe ratios of these portfolios, especially for small-capitalization stocks, are consistently higher than those of the market, confirming a low-volatility effect. However, gross outperformance of the large-capitalization low-volatility portfolio is modest for 1963-1984. The strong performance of the small-capitalization low-volatility portfolio derives from its high raw returns.
In summary, evidence mostly supports belief that there is a low-volatility effect among U.S. stocks that is distinct from, and perhaps stronger than, the value premium.
Cautions regarding findings include:
- Findings are gross, not net. Accounting for trading frictions associated with monthly low-volatility portfolio rebalancing/reformation would reduce portfolio performance. In mitigation, the author reports that results are similar for annual rebalancing.
- Maintaining a diversified low-volatility portfolio is beyond the reach of some investors, who would bear fees for delegating maintenance to a fund manager.