A subscriber suggested evaluating Sentdex Sentiment Trading Signals. These signals attempt to derive the emotion of a current body of text (over 20 sources, mainly Reuters, Bloomberg, WSJ, LA Times, CNBC, Forbes, Business Insider and Yahoo Finance) regarding financial assets such as individual stocks and stock indexes. Signal values are 24-hour averages, ranging from -3 (strongest negative) to +6 (strongest positive), available daily (if there is any relevant news) 30 minutes before market open. The offeror’s backtest buys when sentiment is +6 and sells when it turns negative, with a -0.5% stop-loss. To evaluate, we extract from offered sample data Sentdex sentiment series for Apple (AAPL) and Bank of America (BAC). We apply the backtest rules, except the stop-loss, to these series using daily opening prices for these stocks, adjusted for dividends and splits. We do not use the stop-loss rule because: (1) it may obscure sentiment informativeness; and, (2) research on stop-losses is at best equivocal on their effectiveness. When considering strategy frictions, we use a 0.1% stock-cash switching fee and a $10 monthly data fee. We ignore return on cash, which is practically zero over the sample periods. We use buy-and-hold as a benchmark. Using the specified Sentdex sentiment series and contemporaneous daily adjusted opening prices for AAPL (mid-October 2012 through mid-June 2015) and BAC (mid-November 2012 through mid-June 2015), we find that:
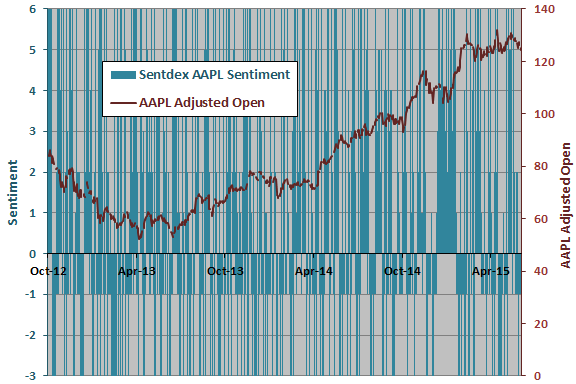
First, we look at AAPL. The following chart tracks daily Sentdex AAPL sentiment and AAPL adjusted opening daily price over the available sample period. The horizontal axis is in calendar days (Sentdex data includes weekends and holidays), so there are small gaps in the AAPL price series. The sentiment readings are highly volatile with few extended runs of positive or negative sentiment. This visualization does not support evaluation of sentiment signals.
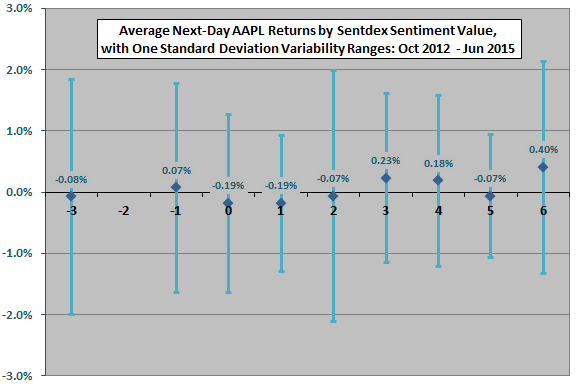
As a conceptual test, we relate daily sentiment level to average next-day AAPL return.
The next chart summarizes average next-day AAPL returns by Sentdex sentiment values over the available sample period, with one standard deviation variability ranges. The number of observations varies considerably from 0 for sentiment -2 to 232 for sentiment -1, so confidence in average returns also varies. While average return for sentiment +6 is strongest, average returns do not increase systematically with sentiment, undermining belief in reliable signal informativeness.
Is there a longer-term relationship between Sentdex AAPL sentiment and AAPL return?
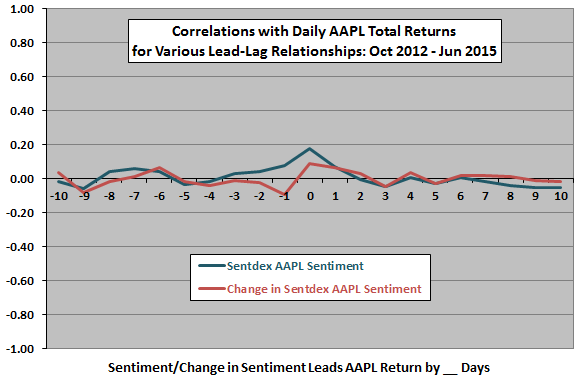
The next chart summarizes correlations between daily Sentdex AAPL sentiment/change in sentiment and daily AAPL return for various lead-lag relationships, ranging from return leads sentiment metrics by 10 days (-10) to sentiment metrics lead return by 10 days (10). Results include:
- The strongest relationship is positive and coincident (unexploitable). In other words, good (bad) returns boost (depress) immediate sentiment.
- Sentiment has a modestly positive relationship with next-day return.
- Sentiment has practically no relationship with future returns beyond the next day.
Next, we look at the time series strategy test for AAPL.
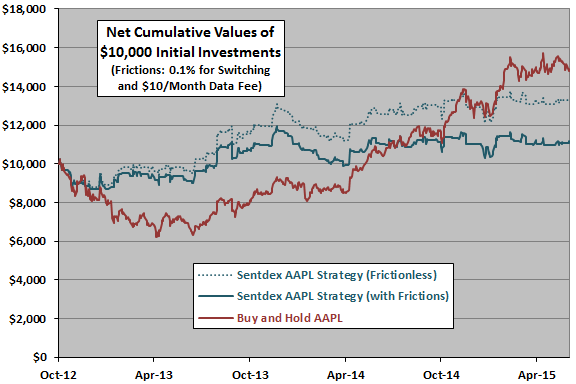
The next chart tracks cumulative values of $10,000 initial investments in three strategies applied to AAPL:
- Sentdex AAPL Strategy (Frictionless) – apply the sentiment-based rules specified above to daily opening prices, excluding stock-cash switching costs and sentiment data fee.
- Sentdex AAPL Strategy (with Frictions) – apply the sentiment-based rules specified above to daily opening prices, including stock-cash switching costs and sentiment data fee.
- Buy and hold AAPL.
Results broadly indicate that the sentiment strategy suppresses volatility but falls short of the terminal value of buy-and-hold. Notable statistics are:
- Sentiment strategies switch between AAPL stock and cash 157 times, so compounded switching frictions are material.
- Average trade duration for the sentiment strategies is 5.2 calendar days.
- Sentiment strategies are in stock (cash) 43% (57%) of the time.
- Average daily return of AAPL while in stock (cash) is 0.12% (0.04%). Volatilities of daily returns are about the same while in stock and cash.
- Compound annual growth rates are 11.7%, 4.2% and 16.4% for the sentiment strategy without costs, the sentiment strategy with costs and buy-and-hold, respectively.
Outperformance during the price decline and underperformance during price advances suggest randomness in the sentiment signals.
What about BAC?
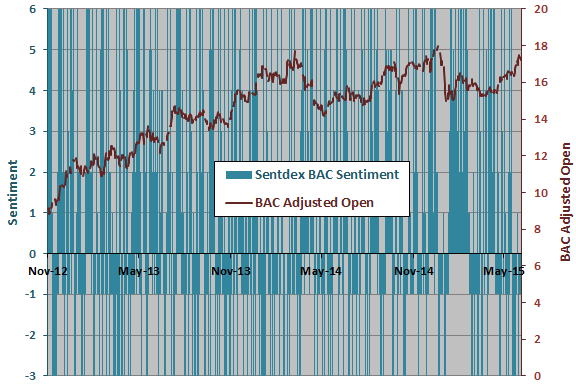
The next chart tracks Sentdex BAC sentiment and BAC adjusted opening price over the available sample period. Again, sentiment readings are highly volatile with few extended runs of positive or negative sentiment. Again, this visualization does not support evaluation of sentiment signals.
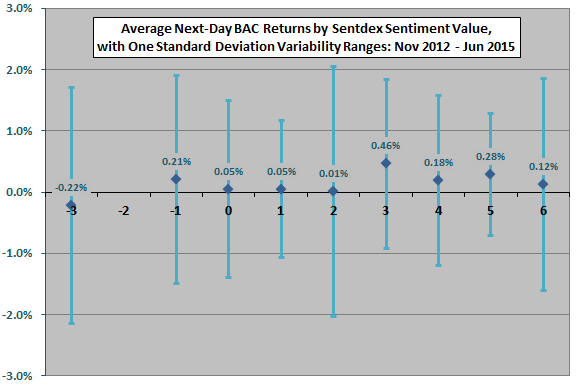
As a conceptual test, we relate daily sentiment level to average next-day BAC return.
The next chart summarizes average next-day BAC returns by Sentdex sentiment values over the available sample period, with one standard deviation variability ranges. The number of observations varies considerably from 0 for sentiment -2 to 233 for sentiment -1, so confidence in average returns also varies. Average returns do not increase systematically with sentiment, undermining belief in the signal informativeness.
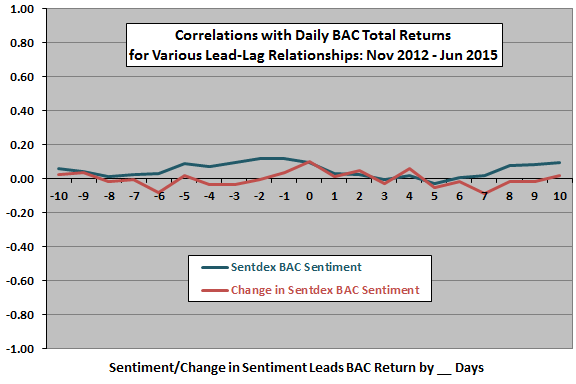
Is there a longer-term relationship between Sentdex BAC sentiment and BAC return?
The next chart summarizes correlations between daily Sentdex BAC sentiment/change in sentiment and daily BAC return for various lead-lag relationships, ranging from return leads sentiment metrics by 10 days (-10) to sentiment metrics lead return by 10 days (10). Results include:
- Good (bad) returns over the past week or so tend to boost (depress) current sentiment.
- Sentiment has practically no relationship with future returns.
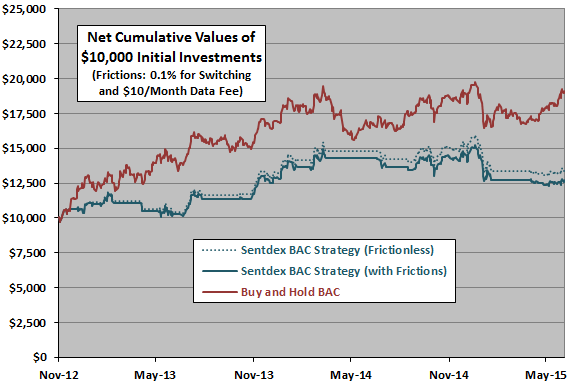
Next, we look at the time series strategy test for BAC.
The final chart tracks cumulative values of $10,000 initial investments in three strategies applied to BAC:
- Sentdex BAC Strategy (Frictionless) – apply the sentiment-based rules specified above to daily opening prices, excluding stock-cash switching costs and sentiment data fee.
- Sentdex BAC Strategy (with Frictions – apply the sentiment-based rules specified above to daily opening prices, including stock-cash switching costs and sentiment data fee.
- Buy and hold BAC.
Results broadly indicate that the sentiment strategy suppresses volatility but fall short of the terminal value of buy-and-hold. Notable statistics are:
- Sentiment strategies switch between BAC stock and cash only 35 times, so compounded switching frictions have a modest effect.
- Average trade duration is 26 calendar days.
- Sentiment strategies are in stock (cash) 49% (51%) of the time.
- Average daily return of BAC while in stocks (cash) is 0.10% (0.12%). Volatility of daily BAC returns is somewhat lower while in cash.
- Compound annual growth rates are 12.2%, 9.8% and 28.8% for the sentiment strategy without costs, the sentiment strategy with costs and buy-and-hold, respectively.
In summary, evidence from tests on two individual stocks is not convincing regarding the informativeness of Sentdex sentiment signals for trading stocks.
Cautions regarding findings include:
- The sample periods available are not long in terms of variety of market conditions.
- AAPL and BAC may be unlucky (or lucky) examples of using Sentdex sentiment for trading.
- It is possible that the offerer used part of the sample dataset for training the text processing software program (in other words, that part of the test is in-sample and therefore upwardly biased). We received no response to a inquiry on this point.