Can individual investors easily mimic the asset allocation strategies, and thereby the returns, of university endowments? In his March 2016 paper entitled “Invest Like an Endowment”, Drew Knowles reviews the asset allocation policies and resultant investment returns of those college and university endowments who volunteer such data to the National Association of College and University Business Officers (NACUBO). He groups endowments into four size categories. He separately reviews Yale University endowment annual reports on allocations and performance as a best practices benchmark. He then analyzes returns for simple asset class allocation clones of endowment categories and the Yale endowment in particular. He builds clones using exchange-traded funds (ETF), augmented by associated indexes before the ETFs are available. He rebalances clones annually in January as NACUBO releases new endowment annual performance reports (with a lag of about six months). For most clones, he groups alternative assets into a broad hedge fund basket. Using nominal category returns during 1988 through 2014, category asset allocations during 2002 through 2014, Yale endowment returns and allocations during 1997 through 2014 and ETF/index total returns over matched periods, he finds that:
- During 1988-2014, larger endowments generally outperform smaller ones.
- The largest category has compound annual growth rate (CAGR) 10.3% and return-risk ratio 1.00, compared to 7.9% and 0.88 for the smallest.
- The largest category has lower allocation to equities/fixed income and higher allocation to alternative investments (including leveraged buyouts, private equity funds and venture capital) than smaller categories.
- The largest endowments presumably can bear greater illiquidity than smaller ones, at least for part of assets.
- During 1997-2014, the Yale endowment outperforms the largest category of endowments (CAGR 13.2% versus 9.9% and return-risk ratio 0.96 versus 0.83), consistently choosing top-quartile managers in asset classes with large performance dispersions.
- During 2003-2015, the S&P 500 Total Return Index beats clones for all four endowment categories based on CAGR, but with a somewhat lower return-risk ratio.
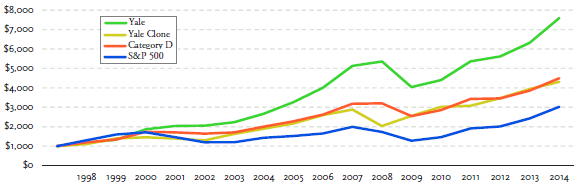
- During 1998-2014, the Yale endowment clone markedly underperforms the Yale endowment (CAGR 9.0% versus 14.0% and return-risk ratio 0.64 versus 0.85). However, this cloning estimate (see the chart below) is the least reliable due to extensive modeling with indexes.
- During 2003-2015, the Yale endowment clone outperforms category clones. It also outperforms a conventional 60-40 stocks-bonds benchmark (CAGR 14.2% versus 11.1% and return-risk ratio 0.69 versus 0.60).
The following chart, taken from the paper, tracks performance of four portfolios during 1998 through 2014:
- Yale endowment as self-reported annually.
- Yale endowment ETF/index clone as described above.
- The category of largest endowments (Category D).
- The S&P 500 Total Return Index.
The Yale endowment clone lags its target by about 3% per year, presumably because Yale allocators add alpha by picking assets/funds that beat asset class proxies used for cloning.
In summary, available evidence is mixed on whether individual investors can easily tap the wisdom of university endowment managers via simple, lagged asset class-level clones.
Cautions regarding findings include:
- Sample periods short for annual performance analysis.
- There is some benefit of hindsight in selecting Yale as the best-performing endowment.
- As noted in the paper, the cloning process ignores some of the asset class granularity in known endowment allocations.
- As noted in the paper, clone allocations lag endowment allocations by about 18 months (the year reported plus a six-month lag).
- Reported clone performances are gross, not net. However, frictions for annual rebalancing are likely small.
- Use of indexes rather than actual ETFs for some or most of clone sample periods ignores fees for managing and administering a tracking fund. Pre-ETF index behaviors do not include any feedback to the market from ETF trading. Available mutual funds may offer more realistic substitutes for ETFs than indexes.
See also “Invest Like the Ivy League?”, “A Few Notes on The Ivy Portfolio: How to Invest Like the Top Endowments and Avoid Bear Markets”, “University Endowment Performance: Strategic versus Tactical Allocation” and “University Endowment Research Summary”.