Does a simple countercyclical (contrarian) asset class allocation rule work well, wherein an investor assumes that a relatively high aggregate allocation to an asset class signals relatively low/risky future returns for that class? In his February 2016 paper entitled “Understanding Modern Portfolio Construction”, Cullen Roche reviews the principles of investing and portfolio construction and examines a simple countercyclical approach for adaptively balancing the risk of losing purchasing power versus the risk of permanent loss via a stocks-bonds portfolio. He hypothesizes that such an approach reduces behavioral risks. Using investment cycle indicators and world/U.S. stock and bond class returns as available during 1952 through 2015, he concludes that:
- The best way to construct a diversified and efficient portfolio is via annually rebalanced index funds consistently fed with fresh contributions.
- The global market portfolio and a basic 60-40 stocks-bonds portfolio are good allocation strategies.
- A countercyclical stocks-bonds allocation strategy that systematically inverts current relative aggregate allocations has lowest allocation to stocks when risk of loss is highest, thereby suppressing drawdowns.
- For world stocks and bonds during 1990-2015 (turbulent stock market):
- Countercyclical portfolio allocations generate compound annual growth rate (CAGR) 7.6%, with annual standard deviation 8.4% and largest annual drawdown -14%.
- A 60-40 portfolio generates CAGR 7.1%, with annual standard deviation 10.9% and largest annual drawdown -22%.
- For U.S. stocks and U.S. Treasuries during 1952-1980 (turbulent bond market):
- Countercyclical portfolio allocations generate CAGR 8.3%, with annual standard deviation 10.8%.
- A 60-40 portfolio generates CAGR 8.4%, with annual standard deviation 11.0%.
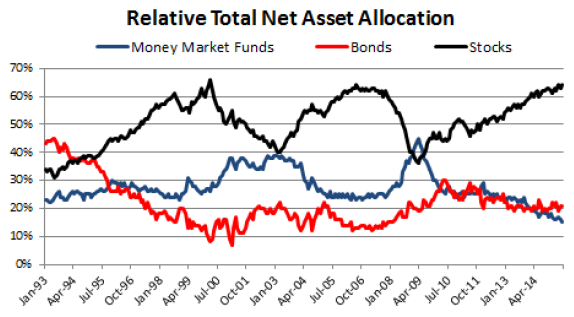
The following chart, taken from the paper, tracks relative aggregate allocations to stocks, bonds and cash since the beginning of 1993. Results suggest mean reversion of allocations over time. One approach to countercyclical asset allocation is to raise (lower) the allocation to a class when its current aggregate allocation is low (high). The paper notes that “there are countless ways in which one could calculate the procyclical risk in the markets…”
In summary, evidence suggests that a contrarian asset allocation strategy that bets against the aggregate allocations of other investors may be attractive.
Cautions regarding conclusions include:
- The sample is not large in terms of number of financial market cycles for testing mean reversion of asset class allocations and therefore the effectiveness of countercyclical allocation strategies.
- As noted in the paper, there are “countless” ways to measure cyclicality in financial markets. Experimenting to find the best countercyclical allocation strategy from among these measures would impound snooping bias in portfolio performance, thereby overstating expectations.
- The paper does not cite data sources or provide detail on portfolio performance calculations. The author separately reports that all data are from Bloomberg.
See “Average Investor Stock Allocation a Better Predictor than P/E10?”, which looks at aggregate allocation to stocks (only) as an indicator of future equity returns.