What is the best way to exploit short-term asset return reversal? In their November 2015 paper entitled “Market Closure and Short-Term Reversal”, Pasquale Della Corte, Robert Kosowski and Tianyu Wang examine four short-term reversal strategies that are each day long (short) assets with below-average (above-average) past returns weighted according to the degree the returns are below (above) average. Portfolio long and short sides are therefore equal in size. Specifically, they assign portfolio weights/accrue portfolio returns based on:
- Prior close-to-open returns/next open-to-close returns (CO-OC).
- Prior close-to-close returns/next close-to-close returns (CC-CC).
- Prior open-to-close returns/next open-to-close returns (OC-OC).
- Prior open-to-open returns/next open-to-open returns (OO-OO).
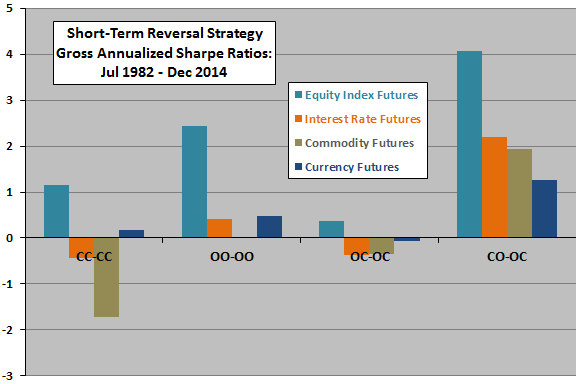
For calculating portfolio profitability, they assume a 50% margin requirement. They apply the strategy to each of U.S. stocks, European (French and German) stocks, Japanese stocks, UK stocks, stock index futures, interest rate (bond) futures, commodity futures and currency futures. Using daily opens and closes for stocks since January 1993 and futures since July 1982, all through December 2014, they find that:
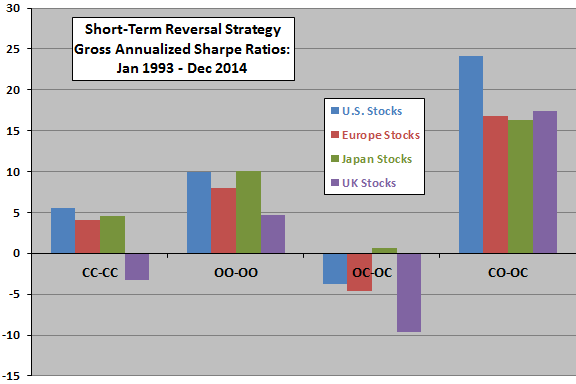
- For U.S. stocks during January 1993 through December 2014, average gross daily returns and gross annualized Sharpe ratios for the four short-term reversal strategies are:
- 1.68% and 24.16 for CO-OC.
- 0.33% and 5.52 for the conventional CC-CC.
- 0.63% and 9.96 for OO-OO.
- -0.17% and -3.80 for OC-OC, suggesting momentum rather than reversal.
- Results are generally consistent, but weaker, for stocks in Europe, Japan and the UK (see the first chart below) over the same period.
- Results are also generally consistent, though much weaker, across asset class futures during July 1982 through December 2014 (see the second chart below).
- CO-OC consistently outperforms all other strategies across stocks and futures in two subperiods with break point at the end of December 2006.
- For U.S. stocks, gross profitability of CO-OC, CC-CC and OO-OO concentrates in smaller, less liquid stocks (but survives in large stocks for CO-OC).
- For U.S. stocks, much of the gross profitability of CO-OC and OO-OO survives adjustment for bid-ask bounce (controlling for the effects of the last measured trade being a buy or sell).
- Tests on S&P 500 stocks indicate that most of the gross profitability of CO-OC occurs immediately after the open. Delaying portfolio formation by one minute dramatically reduces average gross daily return and gross Sharpe ratio. In other words, there is a large premium for rapid calculations/portfolio formation. Using pre-market prices to specify portfolio weights mitigates the need for speed by capturing most of the profitability.
- CO-OC consistently outperforms all other strategies across stocks and futures for a weekly, rather than daily, reversal strategy. However, gross performance is much weaker than for the daily strategy.
- The larger the change in VIX from the prior close to the open, the larger the CO-OC reversal effect for both stocks and, especially, futures.
The following charts, constructed from data in the paper, summarize gross annualized Sharpe ratios for the four short-term reversal strategies specified above. The upper (lower) chart shows results for stocks (futures). Results consistently indicate that:
- CO-OC dominates the other strategies.
- OO-OO is more effective than CC-CC.
- OC-OC involves momentum rather than reversal.
All four strategies generate extremely high portfolio turnover (~100% per day), which would substantially reduce any profitability.
In summary, evidence indicates that the best way to capture the short-term reversal effect for both stock and futures is to weight assets according to the opposite of overnight returns and capture the subsequent intraday returns.
Cautions regarding findings include:
- Reported performance statistics are gross, not net. As noted, daily short-term reversal strategies have approximately 100% daily turnover. Accounting for the costs of daily portfolio reformation would dramatically reduce reported performance.
- Testing multiple strategies on the same data introduces snooping bias, such that the best-performing strategy overstates expected returns. Testing across different samples and subsamples mitigates this concern.