How should investors (particularly retirees) think about balancing short-term crash risk and long-term portfolio sustainability? In their March 2016 paper entitled “Asset Allocation with Short and Long Term Risk Objectives”, Peng Wang and Jon Spinney present a way to balance short-term and long-term portfolio performance risks. They consider portfolios that each month allocate all funds in fixed weights to a mix of stocks (MSCI ACWI Index), bonds (Barclays U.S. Aggregate Index) and real estate investment trusts (MSCI Global REIT Index). They measure short term risk as the average of the worst 1% of annual returns from 10,000 bootstrapping simulations that randomly draw three months of returns at a time from 20-year historical pool of returns for these indexes, thereby preserving some monthly return autocorrelations and cross-correlations. They measure long-term risk as the probability that portfolio value is below its initial value after ten years from 10,000 Monte‐Carlo simulations based on expected asset class returns, pairwise asset return correlations, inflation, investment alpha (baseline constant 1% annually) and withdrawals (baseline approximately 5% annual real rate). Using monthly returns for the asset class proxies during January 1995 through October 2015 and longer samples to estimate ten-year returns and return correlations, they find that:
- In general, strategies with 5% annual real withdrawals and 1% annual alpha that tilt strongly toward stocks have high short-term risk and low long-term risk, while those that tilt strongly toward bonds have opposite risks (see the chart below). For example:
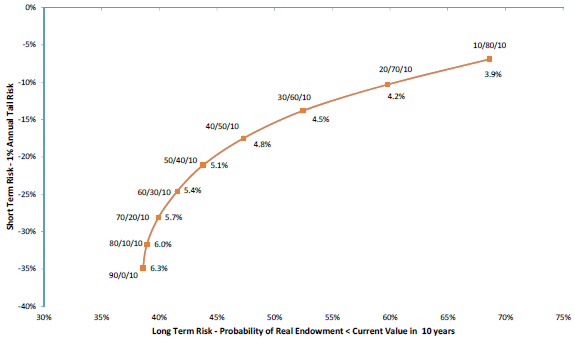
- The 90-0-10 stocks-bonds-REITs allocation has annual tail loss about -35% and probability of losing real value after ten years less than 40%.
- The 10-80-10 allocation has annual tail loss less than -10% but probability of losing real value after ten years about 70%.
- A conventional 60-30-10 allocation offers balance between short‐term risk (annual tail loss -25%) and long‐term risk (probability of losing real value after ten years about 40%).
- Adding alpha through active management significantly reduces long term risk for a given level of short‐term risk. For the 60-30-10 portfolio with 5% real annual withdrawals, probability of losing real value after ten years declines by more than 10% for every 1% increase in annual alpha, with the same short-term risk.
- Decreasing (increasing) the annual withdrawal rate steepens (flattens) the short-term/long‐term risk trade-off graph. Increasing the withdrawal rate from 5% to 6% increases the probability of losing real value after ten years by 8% to 15% depending on asset allocation.
The following chart shows the short-term/long-term risk interaction profile for simulations of different stocks-bonds-REITs portfolio allocations (rebalanced monthly) with 1% alpha and approximately 5% real annual withdrawals. In general, a high allocation to stocks (bonds) decreases (increases) long-term risk but increases (decreases) short-term risk. However, the relationship is not linear, such that a balanced approach leans toward stocks.
In summary, results of portfolio performance simulations with annual withdrawals and some alpha suggest that balancing short-term and long-term risks means tilting a conventionally diversified portfolio toward stocks.
Cautions regarding findings include:
- Bootstrapping and simulation assumptions may not match reality.
- Analyses use indexes rather than tradable assets in constructing simulations, thereby ignoring any costs of creating/maintaining tradable tracking funds. These costs may vary by asset class and therefore affect interactions. Analyses also ignore monthly rebalancing costs. Ignoring costs may understate long-term risk probabilities.