Are the backtests provided for alternative beta investment products representative of their future live performance? In their March 2016 paper entitled “Quantifying Backtest Overfitting in Alternative Beta Strategies”, Antti Suhonen, Matthias Lennkh and Fabrice Perez compare the backtested and live performances of alternative beta products offered by investment banks. The strategies underlying these products are formulaic and non-discretionary, designed to extract risk factor/style premiums (such as value, momentum, carry or term) or exploit some financial market anomaly (such as turn-of-the-month or mean reversion). Specifically, they:
- Present an overview of alternative beta products offered by investment banks.
- Compare backtested and live performance data for these products.
- Compare backtested and live factor exposures four four strategy families (equity value, equity volatility, fixed income term and currency exchange carry).
Using daily returns in U.S. dollars of 215 alternative beta strategies across five asset classes and 11 strategy types offered by 15 investment banks as available during January 1990 through early March 2015, they find that:
- The average length of backtest (live) sample periods is 10.7 (4.6) years. During 2005-2009 (2010-2014), 96 (125) strategies go live.
- The median annualized Sharpe ratio for live products (0.31) is 73% lower than that of associated backtests (1.20). (See the first chart below.)
- 18 of 215 products have live Sharpe ratios at least as large as their backtested Sharpe ratios.
- 65 of 215 products have a negative live Sharpe ratio.
- While 50% or higher for all asset classes, the magnitude of backtested-to-live Sharpe ratio deterioration varies (see the second chart below). Deterioration is:
- Most pronounced in currencies as an asset class and among event-driven, value and carry strategy types.
- Least pronounced among multi-asset and fixed income classes and volatility and trend-following strategy types.
- About 30% stronger for the most complex strategies (many trading rules, filters and parameters) than the simplest ones.
- Regarding exposures to targeted factors during backtested and live samples for four strategy types:
- All four strategy types have significantly positive targeted alphas in backtests, but these alphas fall by half in live samples.
- Live targeted alphas are significantly positive for equity volatility, interest rate term and currency exchange carry strategy types.
- Live targeted alpha for the equity value strategy type is not significant.
- More recent products appear to be better at retaining targeted factor exposures in live samples than older products.
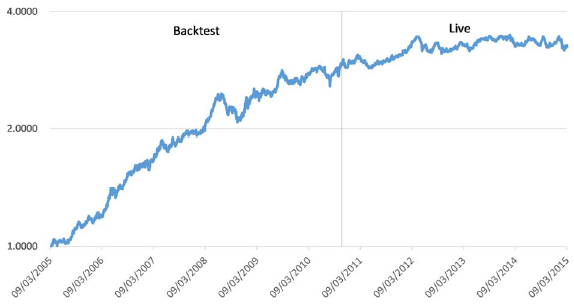
The following chart, taken from the paper, illustrates the difference between backtested performance and live performance for one alternative beta product that goes live in October 2010. This strategy is representative of the median of all 215 products, with a backtested (live) Sharpe ratio 1.42 (0.36) for a deterioration of 75%.
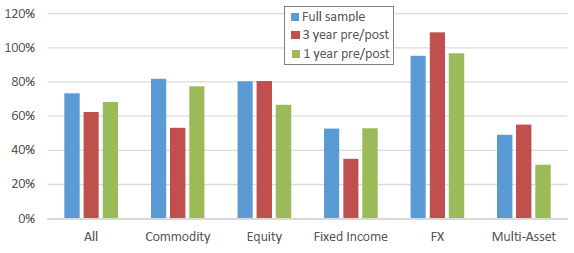
The next chart, also from the paper, summarizes median alternative beta product Sharpe ratio deterioration (backtested Sharpe ratio minus live Sharpe ratio, divided by backtested Sharpe ratio) overall and by asset class for:
- Full sample: complete available backtested and live periods.
- 3 year pre/post: the last three years of backtest performances and the first three years of live performances.
- 1 year pre/post: the last year of backtest performances and the first year of live performances.
The magnitude of deterioration varies somewhat across asset classes and measurement intervals, but is at least 50% for all asset classes using full samples. Based on these results, the industry practice of derating backtested Sharpe ratios by 50% is not conservative enough.
In summary, evidence from live performance data supports belief that that alternative beta products generally suffer from backtest overfitting and unreliable factor/anomaly exposure.
Cautions regarding findings include:
- More rigorous controls for data snooping may close the gap between backtested and live performance. See “Navigating the Data Snooping Icebergs”, “Snooping Bias Accounting Tools” and “Taming the Factor Zoo?”.
- Backtested-to-live performance deterioration may derive from market adaptation instead of/in addition to data/model snooping.