Are any trading strategy backtest performance statistics predictive of out-of-sample results? In their March 2016 paper entitled “All that Glitters Is Not Gold: Comparing Backtest and Out-of-Sample Performance on a Large Cohort of Trading Algorithms”, Thomas Wiecki, Andrew Campbell, Justin Lent and Jessica Stauth compare backtest and out-of-sample performance statistics for 888 algorithmic trading strategies. They first screen a larger set of strategies to remove duplicates, outliers and algorithms unlikely to represent real strategies. They next test the selected strategies in-sample (IS) with data that was available to the developers (from 2010 through deployment dates between January and June in 2015). They then test the strategies out-of-sample (OOS) during June 2015 through February 2016. All tests employ minute-by-minute prices for trade entry/exit and include robustly estimated trading frictions. Performance metrics derive from end-of-day positions/prices. Most tests are linear regressions relating individual IS-OOS performance metrics (such as Sharpe ratio). They also examine abilities of several multivariate machine learning techniques to predict performance, ultimately via an an equal-weighted portfolio of the 10 strategies predicted to have the highest OOS Sharpe ratios. Using position and price data for the 888 strategies during the specified IS and OOS periods, plus the total number of backtest days actually employed by each strategy developer, they find that:
- OOS versus IS linear regressions for individual performance statistics generate R-squared statistics in the range 0.01-0.02, meaning that IS performance explains only 1%-2% of OOS behaviors (see the scatter plots below).
- Sharpe ratio and Sortino ratio have the highest (but still very low) OOS predictability with positive correlations.
- For Sharpe ratio, the last year of IS data works better than the full IS sample.
- Annual returns exhibit slightly negative correlation, suggesting that developers intensively overfit average return but (relatively) ignore volatility.
- Information ratio, market alpha and Calmar ratio exhibit no IS-OOS predictability.
- Risk metrics that do not rely on average returns exhibit substantial IS-OOS predictibiliy, such as annual volatility (R-squared 0.67) and maximum drawdown (R-squared 0.34).
- The more intense the backtesting (proxied by total number of backtest days used by the developer), the larger the IS-OOS performance gap.
- Non-linear machine learning software trained on multiple IS variables predict OOS Sharpe ratio with much higher accuracy (R-squared 0.17). An equal-weighted portfolio of the top 10 strategies from the best machine learning software generates net annualized OOS Sharpe ratio 1.8, much higher than 99% of portfolios of 10 randomly selected strategies and a portfolio of the 10 strategies with the highest IS Sharpe ratios (0.7).
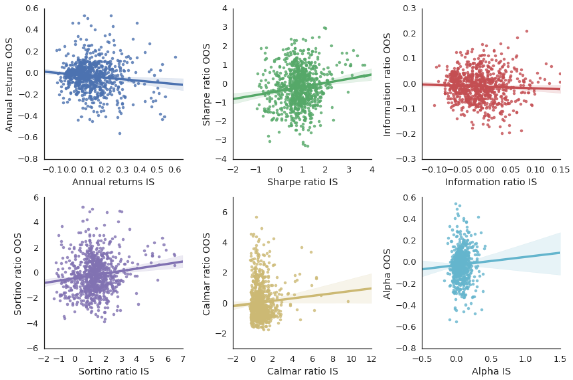
The following charts, taken from the paper, are scatter plots of OOS versus IS performances of the 888 strategies for six performance metrics: (1) annual return, (2) Sharpe ratio, (3) information ratio, (4) Sortino ratio, (5) Calmar ratio and (f) market alpha. Shaded areas around best-fit lines indicate 95% confidence intervals. All IS-OOS correlations are weak (regardless of statistical significance).
In summary, evidence from a large number of actual algorithmic trading strategies indicates that backtest performance generally does not predict out-of-sample performance, and that backtest overfitting is widespread.
Cautions regarding findings include:
- As noted in the paper, some or many developers of tested strategies may be unsophisticated in controlling for snooping bias.
- As noted in the paper, while considering a large number of trading strategies, the aggregate IS-OOS duration is fairly short, especially in terms of variety of market conditions (essentially a single bull market with low volatility).
- Machine learning techniques for relating IS and OOS performances are beyond the reach of many investors, who would bear fees for delegating the work to an investment manager.
- Testing different machine learning techniques on the same data introduces another layer of snooping bias (luck for the best technique).
- The portfolios of ten equal-weighted strategies used in the test of machine learning techniques imply daily rebalancing of strategies, which may be costly, thereby lowering reported Sharpe ratios. Also, rebalancing may harvest volatility—differently for different portfolios, somewhat confounding comparison of the three test portfolios.