How fast should individuals plan to grow net worth as they age? To investigate, we examine median levels of household (1) total net worth and (2) net worth excluding home equity from several vintages of U.S. Census Bureau data. We make the following head-of-household age cohort assumptions:
- “Less than 35 years” means about age 30.
- “35 to 44 years” means about age 39.
- “45 to 54 years” means about age 49.
- “55 to 64 years” means about age 59.
- “65 to 69 years” means about age 67.
- “70 to 74 years” means about age 72.
- “75 and over” means about age 78.
We also assume that wealth growth between these ages is constant via compound annual growth rate (CAGR) calculations. Using median levels of total net worth and net worth excluding home equity from 2000. 2005, 2010, 2014, 2017 and 2019 Census Bureau summary tables, we find that:
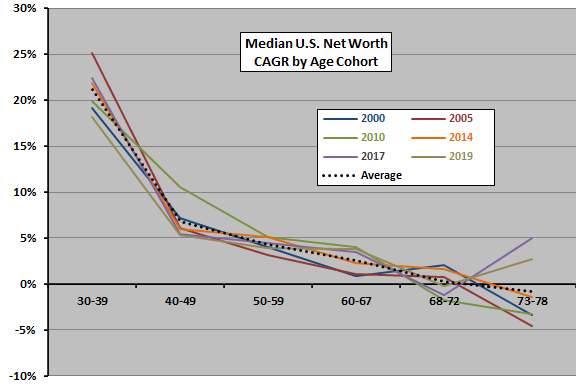
The following chart summarizes median total net worth CAGRs by age range for the four vintages of data, plus average CAGRs across the four vintages. Results suggest that the median household in the U.S. grows total net worth by about:
- 21% annually while the head of household is in the 30s.
- 7% annually while in the 40s.
- 4% annually while in the 50s.
- 3% annually on the cusp of retirement (early through middle 60s).
- 0% annually during early retirement.
- -1% annually in later retirement.
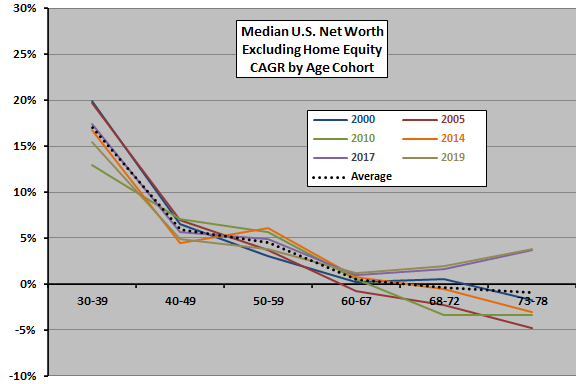
Illiquid home equity is generally a major component of total net worth. What happens when we exclude home equity from net worth?
The next chart summarizes median net worth excluding home equity CAGRs by age cohort for the four vintages of data, plus average CAGRs across the four vintages. Results suggest that the median household in the U.S. grows the rest of net worth by about:
- 17% annually while the head of household is in the 30s.
- 6% annually while in the 40s.
- 5% annually while in the 50s.
- 0% annually on the cusp of retirement (early through middle 60s).
- 0% annually during early retirement.
- -1% annually in later retirement.
In summary, evidence from U.S. Census Bureau data suggests that individuals must maintain net worth growth rates materially higher than those indicated above to achieve/maintain exceptional wealth.
Cautions regarding findings include:
- Modeling methods are crude, so findings are notional.
- Quality of data is unknown, perhaps impounding biases in sampling and statistical interpretation.
This analysis is related to retirement planning research.