Should investors believe that the financial industry can offer low-cost, liquid funds that reliably mimic Commodity Trading Advisor (CTA) hedge funds? In their June 2016 paper entitled “Just a One Trick Pony? An Analysis of CTA Risk and Return”, Jason Foran, Mark Hutchinson, David McCarthy and John O’Brien identify and examine performances of CTA-like hedge funds across eight distinct categories defined via iterative correlation clustering. Their goal is to determine whether category performance is amenable to modeling (cloning) via liquid exposures to four futures risk factor premiums:
- Value – long (short) high-value (low-value) futures, with “value” based on book-to-market ratios for stock index futures and 5-year change in yields/spot prices/purchasing power for government bonds/commodities/currency forwards.
- Carry – long (short) futures with high (low) roll returns.
- Time series momentum – long (short) futures with positive (negative) 12-month past returns.
- Options-based trend following – from Fung and Hsieh, correlated with trends shorter than time series momentum.
They estimate these premiums from monthly returns of rolling nearest contracts for: 12 global equity index futures series; eight global 10-year government bond synthetic futures series; 22 commodity futures series; and, nine global currency forward series versus the U.S. dollar. They employ a hedge fund screening process that suppresses backfill bias (lucky starts). Using monthly net returns and assets under management (AUM) for specific (not fund-of-funds) and distinct CTA funds with at least 12 months of returns denominated in U.S. dollars and monthly data required to estimate futures risk factor premiums as available during January 1987 through July 2015, they find that:
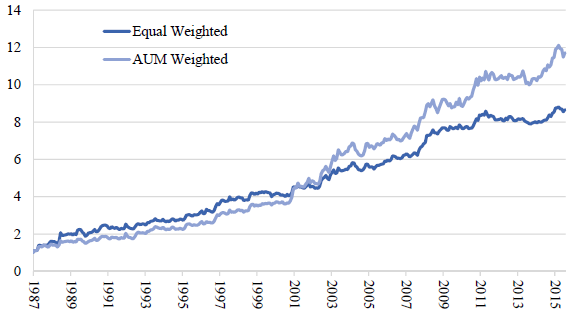
- Regarding performance of the full CTA fund sample (see the chart below):
- Over the entire sample period, an equal-weighted (AUM-weighted) and monthly rebalanced portfolio of all funds generates average annualized return 7.8% (9.0%), with annualized Sharpe ratio 0.38 (0.49).
- Since 1994, an equal-weighted (AUM-weighted) and monthly rebalanced portfolio of all funds generates average annualized return 5.4% (7.7%), with annualized Sharpe ratio 0.37 (0.56).
- Regarding factor premiums since January 1994 (when all source data become available):
- Gross annualized returns for the value, carry, time series momentum and options-based trend following factors are 2.6%, 4.1%, 4.6% and -4.4%, respectively, with gross annualized Sharpe ratios 0.47, 0.78, 0.71 and -0.67.
- Net performances are slightly weaker.
- Value relates negatively to the other three factors. Only time series momentum and options-based trend following relate positively.
- Across all CTA funds:
- Returns relate positively to carry, time series momentum and options-related trend following risk premiums.
- The four-factor model explains 34% (31%) of equal-weighted (AUM-weighted) fund returns, but explanatory power varies considerably over time.
- Equal-weighted funds generate monthly alpha 0.17%, compared to 0.32% for AUM-weighted funds, indicating that alpha concentrates in larger funds.
- However, each category of CTA funds has different sources of return and low return correlations with other categories:
- Over the entire sample period, the Diversified Trend (most strongly related to the time series momentum and options-based trend following factors) and Fundamental Carry (most strongly related to the carry factor) categories produce the highest returns.
- Since January 1994, the Diversified Trend and Longer Term Trend (most strongly related to the time series momentum factor) produce the highest returns.
- Fundamental Value (positively related to the value factor and negatively related to the carry factor) and Option Strategies (most strongly related to the options-based trend following factor) earn the lowest returns in both sample periods.
- Factor premiums explain 14% to 44% of category returns.
- Alpha is significantly positive for three of eight categories (Diversified Trend, Shorter Term Trend and Discretionary) and significantly negative for one (Option Strategies).
The following chart, taken from the paper, shows average cumulative returns for the full CTA fund sample on both equal-weighted and AUM-weighted bases. Results indicate modest volatilities and drawdowns, with smaller funds outperforming during the first half of the sample period and larger funds outperforming during the second half.
In summary, evidence indicates that factor-based CTA-like clone returns are likely to deviate considerably from those of actual CTA funds.
Cautions regarding findings include:
- While not tracking existing aggregate CTA funds closely, there may be practical and attractive ways to harvest the four premiums considered. The authors do not explore this possibility.
- Testing many strategy categories on the same data impounds snooping bias, such that the best-performing categories may be materially lucky and overstate expectations.
- Some other factor model of CTA funds may work better.