Is nearness to 52-week highs or lows informative about future stock returns? In their June 2016 paper entitled “Nearness to the 52-Week High and Low Prices, Past Returns, and Average Stock Returns”, Li-Wen Chen and Hsin-Yi Yu examine the power of extreme price levels (52-week highs and lows) to predict stock returns, and whether any such predictive power is distinct from the momentum effect. They focus on the left (right) tail of nearness to 52-week low (high), because these stocks may attract the most investor attention. They determine 52-week highs and lows with monthly data. Specifically, they each month form value-weighted portfolios that are:
- Long the bottom 10% and short the top 90% of stocks sorted on nearness to 52-week low.
- Long the top 10% and short the bottom 90% of stocks sorted on nearness to 52-week high.
- For comparison, long the top 10% and short bottom 10% based on returns from 12 months ago to one month ago (momentum strategy).
Using monthly prices (ignoring dividends) for a broad sample of non-financial common U.S. stocks and monthly factor portfolio returns during July 1962 through December 2014, they find that:
- Over the sample period, the average gross monthly return of the:
- 52-week low portfolio is 0.43%, with three-factor (market, size, book-to-market) and five-factor (adding profitability and investment) gross monthly alphas of 0.45% and 0.43%, respectively. Gross annualized Sharpe ratio is 0.48.
- 52-week high portfolio is -0.16%, with three-factor and five-factor gross alphas of 0.45% and 0.43%, respectively. Gross annualized Sharpe ratio is -0.21.
- Momentum portfolio is 1.36%, with three-factor and five-factor gross alphas of 1.67% and 1.58%, respectively. Gross annualized Sharpe ratio is 0.66.
- For extended holding intervals, the:
- 52-week low portfolio reverses to negative in the third month.
- 52-week high portfolio reverses to positive in the second month.
- Momentum portfolio reverses to negative in the tenth month.
- The three portfolios are materially distinct:
- The monthly return correlation between the 52-week low (high) portfolio and the momentum portfolio is -0.44 (+0.38).
- The monthly return correlations between the 52-week low and the 52-week high portfolios is -0.33.
- Double sorts and time series regressions confirm that 52-week low and high effects are distinct from the momentum effect.
- The momentum portfolio has a strong positive average return in an up market (positive return over the past two years) but insignificant average return in a down market. The 52-week low strategy is profitable in both market states, but more so in a down market than an up market.
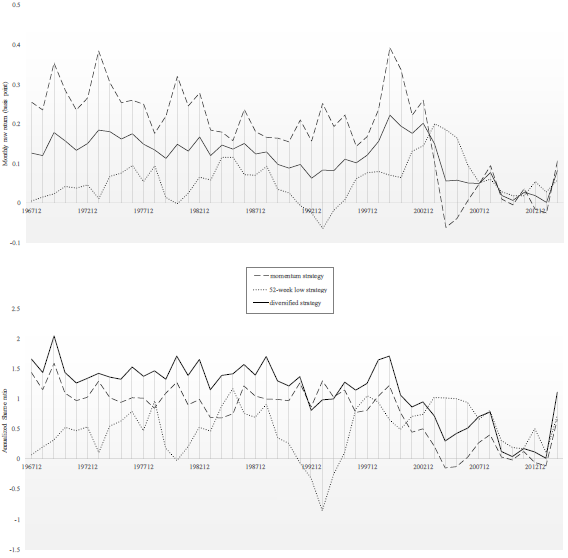
- A diversification portfolio that each month allocates half of capital to each of the momentum and the 52-week low portfolios suppresses momentum volatility and boosts gross annualized Sharpe ratio to 0.98 (see the charts below).
- Findings are generally robust to different nearness thresholds and other changes in portfolio specifications.
The following charts, taken from the paper, compare average gross monthly returns for 5-year rolling windows (upper chart) and gross annualized Sharpe ratios for 5-year rolling windows (lower chart) for the 52-week low and momentum portfolios specified above, and for a diversification portfolio that each month allocates half of capital to each. Results indicate that:
- The momentum portfolio usually generates the highest returns (but is notably weak late in the sample period).
- The 52-week low portfolio tends to be strongest when the momentum portfolio is weakest.
- The Sharpe ratio of the diversification portfolio is therefore mostly the highest (but is not particularly attractive late in the sample period).
The diversification portfolio never has a negative average gross return or a negative gross Sharpe ratio.
In summary, evidence suggests that stock momentum investors may be able to boost risk-adjusted performance by focusing on stocks near their 52-week lows.
Cautions regarding findings include:
- Results are gross, not net. Portfolio turnovers may be high, and accounting for monthly reformation costs and shorting costs may lower performance substantially. Shorting constraints (no shares to borrow) may preclude full implementation.
- As noted, momentum and diversification portfolios are weak in recent years, suggesting market adaptation.
- Calculating 52-week highs and lows at higher frequencies than monthly may affect findings.
- Testing multiple strategies on the same data introduces data snooping bias, such that the best-performing strategy overstates expectations.
For related research, see the following: