Should investors focus on past Sharpe ratio when picking individual stocks? In their June 2016 paper entitled “Don’t Stand So Close to Sharpe”, Angel Leon, Lluis Navarro and Belen Nieto compare 32 past performance metrics for effectiveness in selecting large capitalization U.S. stocks. They categorize these metrics into four groups:
- Eight related to Sharpe ratio.
- Six partial moment formulas (based on downside, or both downside and upside return variability, including Sortino and Omega ratios as special cases) for different levels of gain seeking/loss avoidance investment styles.
- 14 tail risk measurements (such as value at risk) for different levels of gain seeking/loss avoidance investment styles.
- Four measures of average return per unit of risk that do not fit within the other three groups.
Their asset sample is all stocks continuously in the S&P 500 Index over the sample period. They rank these stocks daily over a 264-day rolling window of past returns for each of the 32 metrics and reform respective equally weighted portfolios of the top 20 stocks (about 5%). They compare these portfolios based on next-day return statistics and on overlap of stocks selected, with the Sharpe ratio portfolio as a benchmark. Using daily total returns for the 424 stocks that are continuously members of the S&P 500 Index during January 2005 through September 2014, they find that:
- Portfolio compositions are similar for metrics within the same group. The partial moment group is most distinct from the other groups and has the most within-group variation (across investment styles).
- Performances of portfolios based on the 32 metrics vary considerably, with particularly good results for the Group 2 metrics that include a downside return variability term in the denominator and an upside return variability term in the numerator (designated “FT” portfolios). The FT portfolios, consolidated via principal component analysis (see the chart below):
- Have by far the largest average gross daily return.
- Have uniquely positive gross daily return skewness.
- Have by far the highest daily average gross return-to-risk ratios, whether risk derives from beta, standard deviation, tail loss or maximum drawdown.
- Exhibit the lowest levels of daily gross return correlation with all other portfolios.
- Tend to select value stocks with relatively low prices and high volatilities in down markets.
- Generate gross statistical behaviors similar to a portfolio that buys (sells) stocks that have gone down (up).
- Have average daily turnovers similar to or lower than that of the Sharpe ratio portfolio (8.2%).
- Applying value weighting (instead of equal weighting) substantially reduces gross performance differences between other portfolios and the benchmark Sharpe ratio portfolio. The FT portfolios mostly outperform the benchmark based on gross cumulative return, but few other portfolios do.
- Rebalancing portfolios monthly rather than daily also reduces gross performance differences between other portfolios and the benchmark Sharpe ratio portfolio. FT portfolios still mostly outperform based on gross cumulative return but have very large drawdowns in 2008 and early 2009.
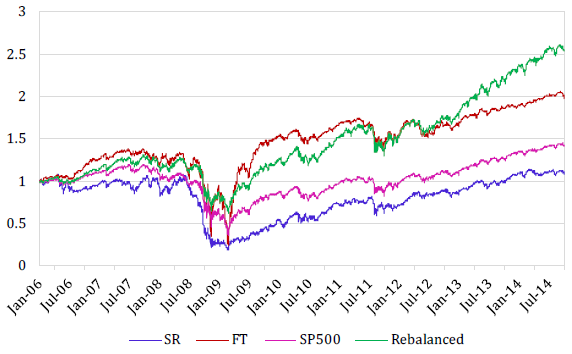
The following chart, taken from the paper, compares cumulative performances over the sample period of one dollar initial investments in each of:
- The equally weighted top 20 stocks based on lagged Sharpe ratio, reformed daily (SR).
- The equally weighted top 20 stocks based on lagged FT metrics, consolidated via principal component analysis and reformed daily.
- The S&P 500 Index (SP500).
- The equally weighted 424 individual stocks in the sample, rebalanced daily (Rebalanced).
Notable points are:
- SR generally exhibits the worst gross performance.
- Rebalanced has the highest gross terminal value.
- FT exhibits relatively strong gross performance, similar to that of the much simpler Rebalanced (correlation 0.92). FT outperformance concentrates in the rebound from the 2008-2009 market crash, thereafter apparently underperforming the other portfolios.
Except for SP500, turnovers are high, such that net results would be much lower for the other three portfolios.
In summary, evidence suggests that lagged Sharpe ratio is likely not the optimal stock ranking metric for large-capitalization U.S. stocks.
Cautions regarding findings include:
- The sample period is very short in terms of independent metric calculation intervals (less than ten). This shortcoming amplifies effects of the very unusual 2008-2009 crash and subsequent 2009 rebound, such that this crisis may dominate overall findings.
- As indicated, portfolio performance results are gross, not net. Portfolio turnovers are high, so net results would be much weaker (but ranking of the active portfolios may not be much different).
- Findings apparently assume no delay between daily metric calculations and portfolio rebalancing. This assumption is problematic for implementation.
- Findings may differ for assets other than the specified 424 relatively stable large-capitalization U.S. stocks.
- Findings may differ for past performance measurement intervals other than 264 trading days and portfolio sizes other than the top 20 stocks.
- Testing many different stock sorting metrics on the same sample introduces snooping bias, such that the best-performing metric overstates expectations.