Is the size effect (small stocks tend to outperform large stocks) related to level of market risk as indicated by expected stock market volatility? In their September 2016 paper entitled “High Risk Episodes and the Equity Size Premium”, Naresh Bansal, Robert Connolly and Chris Stivers investigate the relationship between the size effect and two measures of expected stock market volatility: (1) during 1960 through 1989, realized volatility (RV) calculated from daily stock market returns over the prior 66 trading days; and, (2) during 1990 through 2014, the CBOE Volatility Index (VIX). To measure the size effect, they focus on Fama-French SMB factor portfolio monthly returns (return of the tenth, or decile, of stocks with the smallest market capitalizations minus the return of the decile of stocks with the largest market capitalizations). They also study return differences between each of the next three smallest deciles and the return of the largest decile. They consider both value weighting and equal weighting of stock deciles. They insert a skip-month between the volatility measurement interval and size effect return measurement intervals of 1, 3, 6 or 12 months. Using the specified monthly and daily data, they find that:
- During both 1960-1989 and 1990-2014, the size effect for cumulative 3-month, 6-month and 12-months returns is reliable and material only after a month (plus the skip-month) when expected volatility measures are in the top 20% (quintile) of the full distribution of values (see the charts below). After the the other four quintiles of monthly volatility, there is no size effect at any tested return horizon. Specifically:
- During 1960-1989, average 6-month cumulative SMB factor return is 5.4% (0.8%) after lagged values of RV in the highest quintile (other four quintiles).
- During 1990-2014, average 6-month cumulative SMB factor return is 5.9% (-0.2%) after lagged values of VIX in the highest quintile (other four quintiles).
- Results hold qualitatively during 1960-1974 and 1975-1989 subperiods for RV, and during 1990-mid-2002 and mid-2002-2014 subperiods for VIX.
- Using the value-weighted second, third and fourth smallest deciles of stocks, rather than the very smallest, to define the size effect confirms that the effect is not confined to microcaps.
- Using equal-weighted deciles produces somewhat stronger results.
- Using a European version of SMB factor returns and the German VDAX to measure expected market volatility produces similar results during 2001-2015.
- Average one-month SMB factor returns after highest quintile of RV or VIX months, while positive, are small and not statistically significant.
- An out-of-sample test during 1965-2014 that uses the RV distribution of the prior 180 months to determine when last-month RV is in the top quintile generates average future 3-month, six-month and 12-month cumulative SMB returns of:
- 3.2%, 5.6% and 9.0%, respectively, after a month with RV in the top quintile.
- -0.1%, 0.2% and 1.2%, respectively, after other months.
- Decomposition of VIX into realized volatility and volatility risk premium (VRP) components based on high-frequency returns indicates that size effect dependence is on lagged realized volatility and not on VRP.
- Higher sensitivity of small stocks to market volatility, default and illiquidity risks apparently drive the non-linear positive risk-return relationship identified as the size effect.
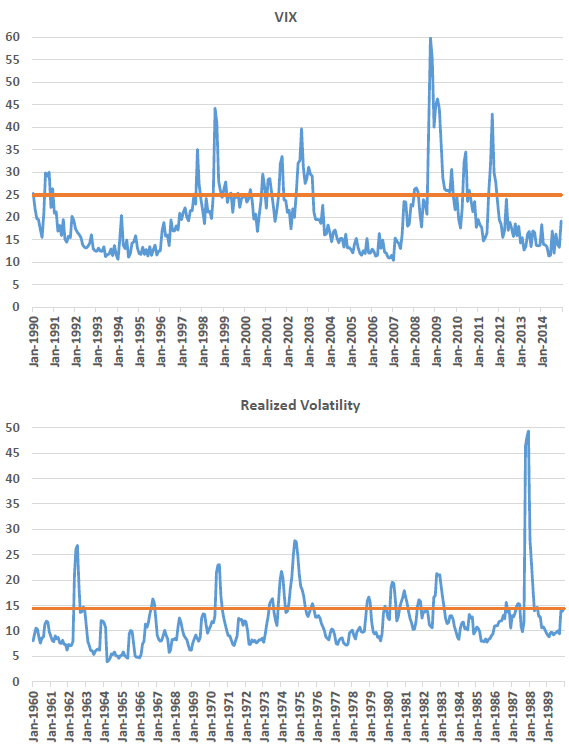
The following charts, taken from the paper, show the time series of VIX (upper chart) and RV (lower chart) over specified sample periods. In each chart, the horizontal orange line indicates the 80th percentile value of the full distribution. Values above these lines are in the top quintile of respective expected volatility measurements as discussed above.
These quintile break points are in-sample. An investor operating in real time during the sample periods could not know the full sample distributions.
In summary, evidence indicates that the stock size effect derives entirely from episodes when expected market volatility is unusually high.
Cautions regarding findings include:
- Reported findings are gross, not net. Factor returns do not account for the cost of periodic portfolio reformation or any costs of shorting. Some stocks in the short sides of portfolios may be costly or impossible to short due to scarcity of shares for lending. Net findings may differ from gross findings.
- As noted in the paper, many tests use in-sample (full sample period) determination of volatility quintile thresholds. The 180-month historical rolling window of volatilities used in the out-of-sample test may be snooped.
- The use of a skip-month in modeling the relationship between expected market volatility and the size effect may be snooped.
- Since small stocks perform similarly to large stocks when lagged volatility is not very high, it is not obvious that investors can exploit findings to beat buying and holding small stocks.