Enterprise multiple (EM) is the ratio of enterprise value (EV) to earnings before interest, taxes, depreciation and amortization (EBITDA), with EV market value of equity plus total debt and preferred stock value minus cash and short-term investments. What happens when EM disagrees with other stock valuation metrics? In their October 2016 paper entitled “Why Do Enterprise Multiples Predict Expected Stock Returns?”, Steve Crawford, Wesley Gray and Jack Vogel investigate how EM interacts with other stock valuation metrics. They first sort stocks into fifths (quintiles) ranked by EM and then re-sort EM quintiles into sub-quintiles based on each of 12 fundamental valuation metrics: (1) financial distress; (2) O-Score (probability of bankruptcy); (3) net stock issuance; (4) composite equity issuance; (5) total accruals; (6) net operating assets; (7) momentum; (8) gross profitability; (9) asset growth; (10) return on assets; (11) investment-to-assets ratio; and, (12) a combination metric derived by first ranking stocks based on each of the 11 individual metrics and then averaging ranks for each stock. There are thus 25 double-sort portfolios for each valuation metric. They then focus on two value-weighted hedge portfolios that concentrate disagreement/agreement between EM and other valuation metrics:
- High-mispricing – long (short) stocks with low (high) EMs and high (low) fundamental valuations, representing extreme disagreement.
- Low-mispricing – long (short) stocks with low (high) EMs and low (high) fundamental valuations, representing extreme agreement.
Portfolio reformations are at mid-year annually for all variables except momentum, for which reformations are monthly. They measure portfolio performance based on monthly return, market alpha, three-factor (market, size, book-to-market) alpha and four-factor (adding momentum) alpha. Using prices and firm fundamentals required to construct specified metrics for a broad sample of U.S. common stocks during July 1972 through December 2015, they find that:
- Confirming prior research, low-EM stocks significantly outperform high-EM stocks over the sample period.
- In general, among the 25 double-sort portfolios for each valuation metric, greater disagreement between EM and the valuation metric translates to higher average future return.
- High-mispricing hedge portfolios generally outperform corresponding low-mispricing hedge portfolios over the sample period. For example:
- Based on the combination valuation metric, the high-mispricing (low-mispricing) portfolio generates average gross monthly return 1.71% (0.34%) with standard deviation 5.79% (5.66%). In other words, disagreement between EM and the combination metric strongly amplifies EM effect return, but not EM effect return variability (see the chart below).
- Average gross monthly returns are higher for high-mispricing portfolios than low-mispricing portfolios for 11 of 12 valuation metrics, significantly so for 8 of 12.
- For all high-mispricing (low-mispricing) portfolios, gross four-factor alphas are significantly positive (not statistically different from zero).
- Earnings announcement returns, forecast errors and forecast revisions all support belief that investor mispricing drives the EM effect. For example, for the combination valuation metric, the high-mispricing (low-mispricing) hedge portfolio generates average gross market-adjusted return 0.87% (-0.18%) during the three trading days around fourth quarter earnings announcements.
- The gross EM effect is stronger during times of strong market sentiment, also supporting belief that mispricing drives the effect.
- However, exploitation of the mispricing-concentrated EM effect is problematic. For example, across the 12 valuation metrics, the short sides of the high-mispricing hedge portfolios generate an average 62% of three-factor alpha.
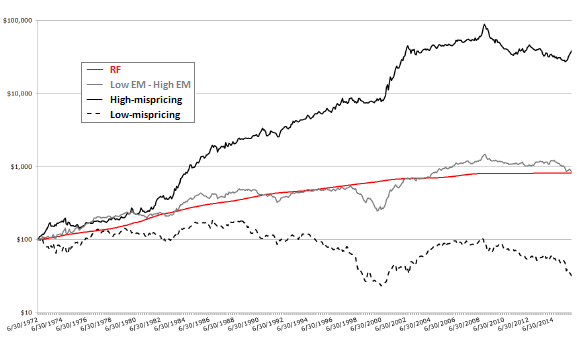
The following chart, taken from the paper, compares gross cumulative values of $100 initial investments in four assets:
- Risk-free (RF), proxied by the 90-day U.S. Treasury bill.
- The EM value factor (Low EM – High EM).
- The high-mispricing hedge portfolio as specified above based on the combination valuation metric.
- The low-mispricing hedge portfolio as specified above based on the combination valuation metric.
Results indicate that mispricing impacts on the EM effect are strong.
In summary, evidence indicates that investors may be able to concentrate the power of EM to predict stock returns by discovering disagreements between EM and other stock valuation metrics.
Cautions regarding findings include:
- Reported returns and alphas are gross, not net.
- Accounting for portfolio reformation costs would reduce performance, but reformation frequencies are annual for 11 of 12 valuation metrics.
- As specifically addressed in the paper, the short sides of concentrated portfolios drive most of the gross alphas. Shorting costs/obstacles may materially reduce performance.
- Data acquisition, calculation and portfolio management burdens are beyond the reach of many investors, who would bear fees for delegating these tasks to an investment manager/fund.
For closely related research, see “Concentrating the Value Premium and Momentum with FSCORE”.