Do retail investors tend to underprice equity options in monthly series when the interval between expirations from third Friday to third Friday is five weeks instead of the more frequent (65% versus 35%) four weeks? In their November 2016 paper entitled “Inattention in the Options Market”, Assaf Eisdorfer, Ronnie Sadka and Alexei Zhdanov examine differences in U.S. equity option return behaviors for “months” with five weeks versus four weeks. They focus on stocks and exchange-traded funds (ETFs) with liquid options (relatively large size and high institutional ownership) and exclude options not expiring on the third Friday. Specifically, they each month on the third Friday form equally weighted portfolios of one-month-to-expiration, at-the-money long straddles (call and put with same strike price), delta-hedged calls and delta-hedged puts (both short the underlying stocks) and hold to maturity on the third Friday of the next month. They also run regressions of average weekly returns for these portfolios versus expiration interval and several control variables found in prior research to affect option returns (index option return, gap between implied and historical volatilities, return skewness and kurtosis, firm size, firm book-to-market ratio, past stock return and idiosyncratic volatility. Using daily returns (from closing bid-ask midpoints for options) for the specified options and underlying stocks/ETFs during 1996 through 2014, they find that:
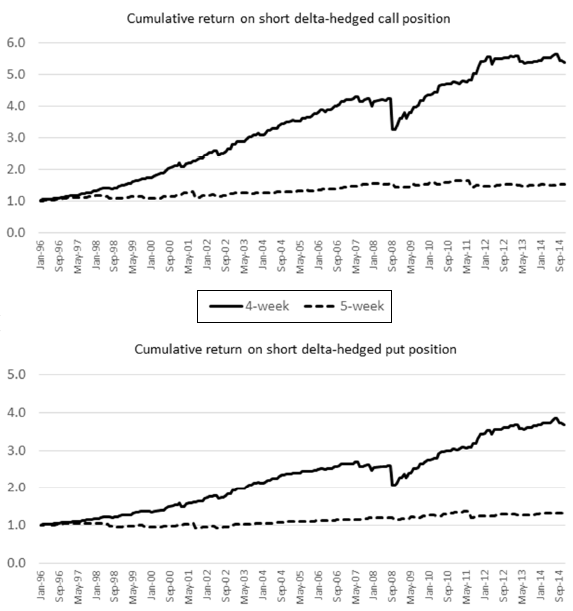
- All three option portfolios specified above generate significantly lower gross returns when the interval between monthly expirations is four weeks than when it is five weeks (see the chart below). Average gross weekly return differences over the entire sample period are 2.6% for straddles, 0.5% for delta-hedged calls and 0.4% for delta-hedged puts.
- Regression results robustly confirm underperformance of the four-week expiration interval compared to the five-week interval with control variables, across subsamples and with dynamic (weekly or daily) delta hedging.
- The effect is stronger for options more likely traded by retail investors (low stock short interest and large difference in call and put implied volatilities).
The following charts, taken from the paper, compares average gross cumulative returns of shorting delta-hedged calls (upper chart) and delta-hedged puts (lower chart) as specified above during months with either four weeks (solid lines) or five weeks (dashed lines) between consecutive expirations. For the four-week interval, average gross terminal returns are over 400% (250%) for shorting delta-hedged calls (puts). Average gross terminal returns for the five-week strategy are 52% (33%) for shorting delta-hedged calls (puts), much lower than naively indicated by the frequency of five-week intervals.
In summary, evidence indicates that individual investors fail to distinguish between four-week and five-week monthly expiration intervals in pricing U.S. equity options, such that shorting options is significantly less profitable for the latter.
Conversely, the cost of hedging stock positions with options is much lower for five-week expiration intervals than for four-week intervals.
Cautions regarding findings include:
- Returns are gross, not net. Trading frictions for options are relatively high and would reduce reported returns (but perhaps not the differences between expiration intervals).
- Findings may differ for equity index options.