Do bonds, like equity markets, offer a variance risk premium (VRP)? If so, does the bond VRP predict bond returns? In their January 2017 paper entitled “Variance Risk Premia on Stocks and Bonds”, Philippe Mueller, Petar Sabtchevsky, Andrea Vedolin and Paul Whelan examine and compare the equity VRP (EVRP) via the S&P 500 Index and U.S. Treasuries VRP (TVRP) via 5-year, 10-year and 30-year U.S. Treasuries. They specify VRP generally as the difference between the variance indicated by past values of variance (realized) and that indicated by current option prices (implied). Their VRP calculation involves:
- To forecast daily realized variances at a one-month horizon, they first calculate high-frequency returns from intra-day price data of rolling futures series for each of 5-year, 10-year and 30-year Treasury notes and bonds and for the S&P 500 Index. They then apply a fairly complex regression model that manipulates squared inception-to-date returns (at least one year) and accounts for the effect of return jumps.
- To calculate daily implied variances for Treasuries at a one-month horizon, they employ end-of-day prices on cross-sections of options on Treasury futures. For the S&P 500 Index, they use the square of VIX.
- To calculate daily EVRP and TVRPs with one-month horizons, subtract respective implied variances from forecasted realized variances.
When relating VRPs to future returns for both Treasuries and the S&P 500 Index, they calculate returns from fully collateralized futures positions. Using the specified futures, index and options data during July 1990 through December 2014, they find that:
- Over the sample period, average annualized:
- Forecasted realized volatility (square root of variance, or standard deviation) for the S&P 500 Index is 15.8% and ranges from 4.0% (5-year) to 9.3% (30-year) for Treasuries futures. All forecasted realized volatilities are highly persistent.
- Implied volatility for the S&P 500 Index is 20.1% and ranges from 4.7% (5-year) to 11.0% (30-year) for Treasuries. Implied volatilities are also highly persistent.
- Over the sample period average annualized:
- EVRP is -13.48 (squared percent), translating to volatility risk premium -4.3%.
- TVRPs are -0.54, -1.59 and -3.24 for 5-year, 10-year and 30-year Treasuries, respectively, translating to volatility risk premiums -0.7%, -1.3% and -1.8%.
- However, TVRPs are much less variable than EVRP, such that adjusting for variability results in similar values.
- Average annualized gross excess (relative to 1-month Treasuries) returns from rolling future series are 2.91%, 0.09%, 1.51% and 1.52% for the S&P 500 Index and 5-year, 10-year and 30-year Treasuries, respectively.
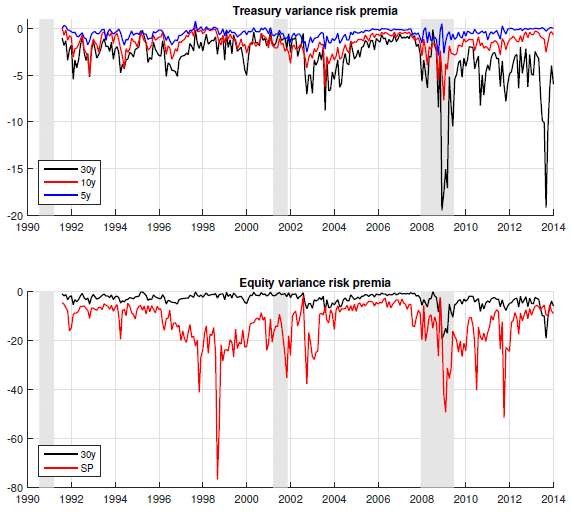
- TVRPs are particularly large during times of distress unique to the bond market and exhibit less extreme variation during times of distress attributable to equity markets only (see the charts below). Correlations between EVRP and TVRPs change faster than those between stock market returns and bond returns.
- Regarding predictability of futures returns:
- Short-term (5-year and 10-year) TVRPs predict excess returns on short-term bonds.
- Both 30-year TVRP and EVRP predict excess returns on 30-year bonds.
- EVRP predicts equity returns for horizons up to six months.
- 30-year TVRP predicts equity returns at 6-month to 12-month horizons.
- Including other widely used equity return predictors in multivariate regressions does not affect the power of EVRP and 30-year TVRP to predict stock market returns.
- However, including widely used bond return predictors (such as term structure slope) in multivariate regressions explains the power of TVRPs to predict bond returns
- Expected inflation is a common factor in explaining the variation of EVRP and TVPRs.
The following charts, taken from the paper, plot TVRPs for 5-year (5y), 10-year (10y) and 30-year (30y) U.S. Treasury notes and bonds (upper chart) and EVRP from the S&P 500 Index (lower chart) in squared percent as specified above. Notable points are:
- TVRP almost always increases with term of the note/bond.
- TVRPs are countercyclical, meaning they are large (small) in magnitude during bad (good) economic times.
- EVRP is much larger than TVRP.
- While EVRP and 30-year TVRP are always negative, 5-year and 10-year TVRPs are sometimes positive.
- EVRP and TVRP respond differently during crises.
In summary, evidence indicates that variance/volatility risk premiums for U.S. Treasury notes and bonds may have useful power to predict their returns, and the premium for long-term Treasuries may usefully predict intermediate-term stock market return.
Cautions regarding findings include:
- A perhaps more intuitive way to present VRP is implied variance or volatility minus forecasted realized variance or volatility (opposite the above), representing the premium investors pay to hedge surprises in expected realized values.
- Tests of VRP power to predict returns are academic. The study does not propose and test any trading strategies.
- The realized volatility forecast method is complex, suggesting potential for snooping via model specifications and/or parameter selections and consequent overstatement of predictive power. Also, Investors would have to delegate forecasting, thereby bearing investment/fund manager fees. Simpler ways to estimate realized volatility may have value, and CBOE offers a 10-year U.S. Treasury Note Volatility Index (TYVIX) for implied volatility.
For simplified approaches to exploiting EVRP, see “Volatility Risk Premium an Exploitable Stock Market Predictor?” and “Exploiting the Volatility Risk Premium with ETNs”.