Does adjusting stocks-bonds allocations according to trend following rules improve the performance of 30-year retirement portfolios? In their November 2016 paper entitled “Applying a Systematic Investment Process to Distributive Portfolios: A 150 Year Study Demonstrating Enhanced Outcomes Through Trend Following”, Jon Robinson, Brandon Langley, David Childs, Joe Crawford and Ira Ross compare retirement portfolio performances for variations of the following three strategies that may hold a broad stock market index, a 10-year government bond index or cash (3-month government bills) in the U.S., UK or Japan:
- Buy and Hold – each month rebalance to fixed 60%-40% or 80%-20% stock-bond allocations.
- T8 – each month set allocations among stocks, bonds and cash according to whether each of stocks and bonds are above (uptrend) or below (downtrend) respective 8-month exponential moving averages (EMA).
- T12 – same as T8 but using a 12-month EMA.
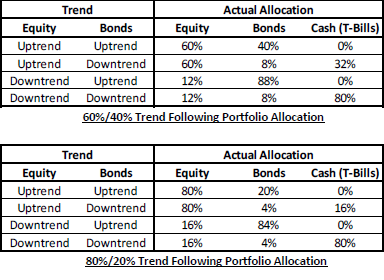
See the first two tables below for precise T8 and T12 allocation rules. The authors consider annual portfolio distributions of 0%, 4%, 4.5% or 5% over a 30-year holding interval. They employ the S&P 500, FTSE 100 and TOPIX total return indexes for the U.S., UK and Japan, respectively. When 3-month government bill data are unavailable for the UK or Japan, they insert U.S. data. Using monthly total returns for the specified asset class proxies since 1865 for the U.S., 1935 for the UK and 1925 for Japan, all through 2015, they find that:
- Compared to buy and hold on a gross basis, applying T8 or T12 trend following rules to U.S. data during 1865-2015:
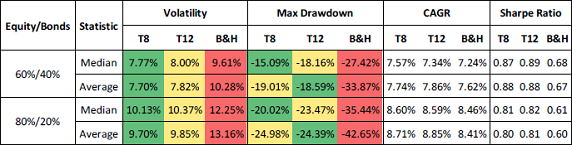
- For both average and median results without annual distributions, consistently boosts compound annual growth rate (CAGR), reduces volatility, reduces maximum drawdown and increases Sharpe ratio (see the third table below).
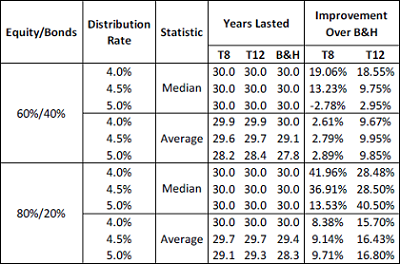
- For both average and median results with annual distributions, matches or increases years-to-portfolio exhaustion and almost always improves terminal portfolio value (see the last table below).
- Consistently matches or reduces portfolio failure rates with annual distributions.
- Compared to buy and hold on a gross basis, applying T8 or T12 trend following rules to UK data during 1935-2015:
- For both average and median results without annual distributions, consistently reduces volatility, reduces maximum drawdown and increases Sharpe ratio, but mostly lowers CAGR.
- For both average and median results with annual distributions, mostly matches years-to-portfolio exhaustion but often reduces terminal portfolio value.
- Mostly matches portfolio failure rates with annual distributions.
- Compared to buy and hold on a gross basis, applying T8 or T12 trend following rules to Japan data during 1925-2015:
- For both average and median results without annual distributions, consistently reduces volatility, reduces maximum drawdown and increases Sharpe ratio, but sometimes lowers CAGR.
- For both average and median results with annual distributions, consistently matches or increases years-to-portfolio exhaustion but consistently reduces terminal portfolio value.
- Consistently matches or reduces portfolio failure rates with annual distributions.
- Trend following allows for an increased allocation to equities without increased volatility relative to buy and hold. For example, across country samples, 80%/20% T8 and T12 have about the same volatility as a 60%/40% Buy and Hold. As a result, at the same level of volatility, trend following creates greater total wealth and supports higher distributions.
The following tables, taken from the paper, summarize allocations to stock index, bond index and cash according to last-month T8 and T12 trend indications. Only four-fifths of baseline stock and bond index allocations are subject to reallocation based on trend. If the stock index is in downtrend and the bond index in uptrend, four-fifths of the stock index allocation goes to the bond index. If both are in downtrends, four-fifths of the stock index allocation and four-fifths of the bond allocation go to cash.
The next table, extracted from the paper, summarizes median and average gross portfolio performance statistics for the 1865-2015 U.S. sample for strategy variations with no annual distributions. Results indicate that the T8 and T12 allocation rules consistently beat Buy and Hold (B&H).
The final table, also extracted from the paper, displays median and average gross years-to-portfolio exhaustion (Years Lasted) and terminal value improvement relative to B&H for the 1865-2015 U.S. sample for the three non-zero annual distribution rates. Results indicate that the T8 and T12 allocation rules almost always match or beat B&H.
In summary, evidence indicates that tactical reallocations based on intermediate-term trend following mostly beats fixed allocations to stocks and bonds in 30-year retirement portfolios.
Cautions regarding findings include:
- Sample periods consist of only 5, 2.7 and 3 independent 30-year intervals for U.S., UK and Japan data, respectively. Use of overlapping intervals weakens statistical findings.
- Older data may not be as reliable as more recent data.
- Liquid assets tracking stock market and government bond indexes may have been unavailable for substantial parts of the sample periods. In other words, constructing and maintaining market portfolios may have been costly (especially for a typical retiree), as suggested by costs and fees/loads of early mutual funds.
- As noted in the paper: “The simulation did not take into account the impact of transaction costs, taxes, bid-ask spreads and slippage. These variables are not believed to materially impact results, a conclusion reached in prior works.” The paper does not include analyses of turnover, trading frictions and tax impacts to support this belief. Trading frictions are high during much of the sample periods, and tax implications are variable and complicated.
- Collection of data for timely trend following and rebalancing calculations may have been problematic for much of the sample periods.
- Testing multiple strategy variations on the same (or highly correlated) data introduces snooping bias, such that the best-performing variations overstate expectations. There may be additional, prior snooping bias from:
- Selection of T8 and T12 trend following rules based on prior knowledge of U.S. data, as suggested by their relatively poorer results for the UK and Japan. Robustness testing for other lookback intervals may mitigate this caution.
- The precise trend following allocation rules.
See also “Retirement Allocation Strategy Informed by P/E10”.