What drives the low-risk stock return anomaly, wherein low-risk stocks outperform high-risk stocks (contrary to a reward-for-risk view)? In their February 2017 paper entitled “Betting Against Correlation: Testing Theories of the Low-Risk Effect”, Clifford Asness, Andrea Frazzini, Niels Gormsen and Lasse Pedersen investigate several ways to select low-risk stocks and infer from findings what drives low-risk outperformance as represented by the Betting Against Beta (BAB) strategy that is long low-beta stocks and short high-beta stocks. Specifically, they consider the following stock sorting selection methods:
- Betting Against Correlation (BAC) – each month: (1) rank stocks into fifths (quintiles) based on volatility; (2) within each volatility quintile, sort stocks into low-correlation and high-correlation halves weighted by correlation rank such that lower correlation stocks have larger weights in low-correlation half and larger correlation stocks have larger weights in the high-correlation half; (3) weight all halves to have market beta one; (4) within each volatility quintile, form a hedge portfolio that is long (short) the low-correlation (high-correlation) half; and (5) compute the BAC factor return as the equal-weighted average of the five hedge portfolio returns.
- Betting Against Volatility (BAV) – similar to BAC, but switching the order and uses of correlation and volatility sorts.
- Low MAX (LMAX) – each month, form a value-weighted portfolio that is long (short) the value-weighted large-capitalization and small-capitalization stocks with the lowest (highest) averages of the five highest daily returns over the last month.
- Scaled MAX (SMAX) – same as LMAX, but adjusted for volatility, using ratios of average of the five highest daily returns over the last month divided by respective volatility over the last month.
- Idiosyncratic Volatility (IVOL) – each month, regress each firm’s daily stock returns over the given month on the daily returns to the market, size and book-to-market factors. IVOL is the residual volatility of this regression (unexplained by factor betas).
They decompose BAB into correlation (BAC) and volatility (BAV) components to distinguish between financial (leverage constraints, swaying institutional investors away from low-beta stocks) and behavioral (return-chasing) forces, respectively. They then compare BAC and SMAX outputs to distinguish between financial and lottery-preference explanations. Using data as available for the U.S. since January 1926 and for 23 other countries since July 1990, all through December 2015, they find that:
- Based on linear regression of BAB on both BAC and BAV, correlation is more important than volatility as a driver of BAB in both U.S. and global samples.
- Both BAB and BAC generate significant 5-factor (market, size, book-to-market, profitability, investment) alphas, consistent with institutional leverage constraints. For example, BAC has a five-factor average gross monthly return (alpha):
- 0.97% (0.70%) in the U.S. during 1963-2015.
- 0.68% (0.37%) globally during 1990-2015.
- BAB and BAC are robust robust to controlling for LMAX, SMAX and IVOL.
- Regarding SMAX, LMAX and IVOL:
- SMAX is robust to controlling for BAB, but LMAX and IVOL are not.
- LMAX and SMAX are not robust to portfolio formation intervals much longer than one month.
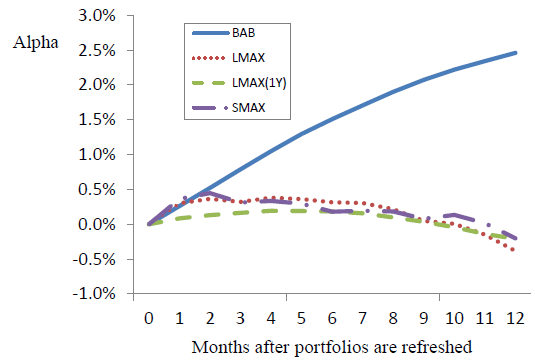
- LMAX and SMAX alphas occur almost exclusively in the month after portfolio formation (see the chart below), requiring high turnovers.
- BAB and BAC are persistent and therefore more implementable than other risk metrics because they do not require high turnovers.
- BAB and BAC (related to systemic risks such as margin debt/investor leverage) tend to outperform LMAX, SMAX and IVOL (related to idiosyncratic risks), especially after taking steps to suppress portfolio turnovers for the latter.
The following chart, taken from the paper, compares gross cumulative 5-factor alphas for BAB, LMAX, LMAX(1Y) with a 1-year rather than 1-month formation interval, and SMAX for 12 months after portfolio formation. Results show that:
- BAB gains are persistent for many months, while lottery stock effects are not. In other words, LMAX and SMAX require frequent portfolio reformation (and associated high portfolio turnovers) to generate alpha, while BAB does not. High turnovers mean high portfolio maintenance costs.
- LMAX(1Y) with a 1-year lookback interval does not generate significant alpha over any horizon.
In summary, evidence suggests that outperformance of low-risk stocks compared to high-risk stocks stems mostly from a persistent (low-turnover) component related to investor leverage constraints and less so from transitory (high-turnover) investor demand for lottery stocks. Preeminence of the former is stronger outside the U.S.
Cautions regarding findings include:
- Reported returns and alphas are gross, not net. Accounting for portfolio reformation frictions would reduce performance statistics. While the authors discuss portfolio turnovers, they do not quantify its impacts.
- Methodologies rely on multiple linear regressions. Underlying forces may be non-linear.
- Portfolio formation rules are fairly complex, indicating:
- There are multiple opportunities to introduce data snooping bias by exploring rule alternatives and parameter values for each strategy. The authors mitigate this concern with sensitivity testing only for LMAX and SMAX by considering other portfolio lookback intervals (and finding lack of robustness).
- Considerable data collection/processing and execution burdens for all strategies are beyond the reach of most investors, who would bear fees for delegating this work to an investment/fund manager.
- Testing many stock selection rules on the same data introduces study-level snooping bias, overstating expectations for the best-performing strategies.
For additional related research, see: