Do very long samples clarify the role of aggregate dividend yield as a stock market return predictor? In their January 2017 paper entitled “Four Centuries of Return Predictability”, Benjamin Golez and Peter Koudijs examine whether aggregate dividend yield (dividend-to-price ratio) predicts stock market return in a pieced sample spanning four centuries. They test predictability in the overall sample and the pieces separately, mostly based on real (inflation-adjusted) data. Using annual stock market price and dividend data and contemporaneous estimates of inflation and the risk-free rate for the Netherlands/UK during 1629-1812, for the UK alone during 1813-1870 and for the U.S. during 1871-2015, they find that:
- Some basic market statistics are:
- For the full sample, average annual nominal stock market return is 8%, ranging from 6% for early data to 12% for recent U.S. data. Since inflation is high after 1945, the range of average annual real returns across subperiods is 6% to 8%.
- The equity risk premium ranges from 2%-3% in early data to 6%-8% in the U.S. after 1870. However, estimates of the risk-free rate are crude prior to 1920, and returns are more volatile in recent data.
- The annual Sharpe ratio for the full sample is 0.31. For U.S. data after 1945, Sharpe ratio is a relatively high 0.47.
- For the full sample, 63% (37%) of real return to investors comes from dividends (capital gains). However, capital gains account for 57% of real returns recently.
- Aggregate dividend yield is stationary over the full sample, with a long-term average close to 5%. However, yield declines after 1950.
- For the full sample, average annual real aggregate dividend growth rate is about 2%, ranging from less than 1% during the 17th and 18th centuries to 5% in the 19th century. Recent dividend growth rate is relatively stable at about 2%.
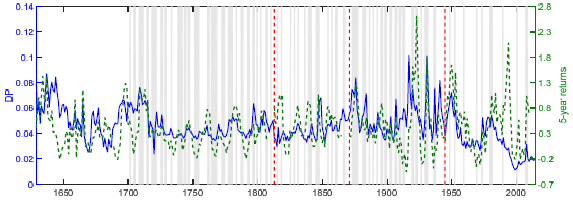
- Aggregate dividend yield reliably predicts stock market return at annual and multi-year horizons both in-sample and, compared to the historical average return, out-of-sample (see the chart below). This finding holds across main subsamples.
- Much of the variation in aggregate dividend yield and expected stock market return relates to the business cycle, with both increasing during economic recessions.
- Except for the recent post-1945 subperiod, aggregate dividend yield also predicts its growth rate. High (low) yield predicts low (high) growth rate.
The following chart, taken from the paper, graphs aggregate dividend-to-price ratio (DP) and subsequent 5-year stock market real return over the full sample period. Shaded areas indicate economic recessions (after 1700 only). Dashed vertical red lines denote the following subperiods: Netherlands/UK during 1629-1812, UK only during 1813-1870), U.S. during 1871-1945 and U.S. during 1945-2015. Visual inspection indicates that the two graphs tend to rise and fall together, confirming statistical tests indicating that high (low) dividend yield indicates relatively weak (strong) future market return. The chart further indicates that dividend yield and future stock market return tend to increase during economic recessions.
In summary, evidence indicates that aggregate dividend yield reliably predicts stock market return at annual and multi-year horizons, but data since 1945 are different in several ways.
Cautions regarding findings include:
- Very old data may derive from crude estimates (as noted in the paper for the risk-free rate), inherently undermining reliability of findings.
- As noted in the paper, the oldest data refers to a stock “market” consisting of just one or a few stocks.
- Analyses are academic. There are no tests of exploitability via stock market timing based on aggregate dividend yield.
- For much of the sample period, investors may not have had access to stock data in a timely enough fashion to exploit findings.
- Just holding the market portfolio may have been problematic for much of the sample period.
- As noted in the paper, there is considerable lag in identifying economic recessions, and simple classification of recessions and expansions does not capture business cycle intensity or secular changes in business conditions.