A subscriber requested a horse race among the following four simple asset class allocation strategies:
- Seasonal SPY-VFITX – the strategy tested in “Bonds During the Off Season?”, which switches between SPDR S&P 500 (SPY) and Vanguard Intermediate-Term Treasury (VFITX) based on the calendar. This strategy switches between U.S. equity risk and U.S. interest rate risk.
- SPY:SMA10-VFITX – a strategy that holds SPY (VFITX) when the S&P 500 Index is above (below) its 10-month simple moving average (SMA10). This strategy also switches between U.S. equity risk and U.S. interest rate risk.
- SACEVS Best Value – the version of the Simple Asset Class ETF Value Strategy (SACEVS), which holds SPY, a corporate bond exchange-traded fund (ETF), a mid-duration U.S. Treasuries ETF or cash according to which offers the best yield. This strategy offers three ways to escape U.S. equity risk and two ways to escape U.S. interest rate risk based on relative yields.
- SACEMS EW Top 3 – the version of the Simple Asset Class ETF Momentum Strategy (SACEMS) that holds the equally weighted (EW) three of nine ETFs spanning multiple asset classes with the highest past returns. This strategy offers multiple ways to escape both U.S. equity risk and U.S. interest rate risk based on relative price trends.
Because of the different available sample periods, we pit 1 vs. 2 since January 1993 (limited by data for SPY), 1 vs. 2 vs. 3 since July 2002 (limited by availability of bond ETFs) and 1 vs. 2 vs. 3 vs. 4 since July 2006 (limited by availability of all ETF asset class proxies). For these tests, we ignore fund switching frictions. Using monthly data for the specified assets through January 2017, we find that:
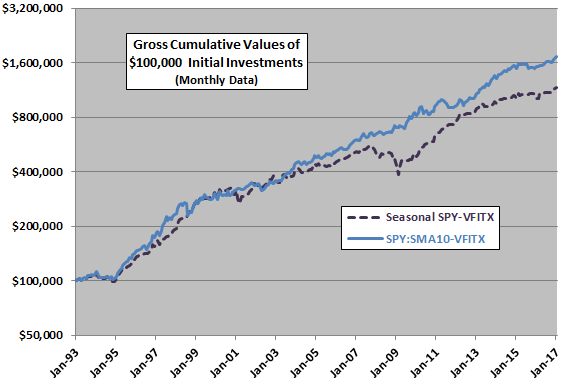
The following chart compares on a logarithmic scale gross cumulative values of $100,000 initial investments at the end of January 1993 in Seasonal SPY-VFITX and SPY-SMA10-VFITX. The latter wins at the end, largely due to outperformance during the financial markets turbulence of 2007-2009.
For deeper understanding, we compare some performance statistics.
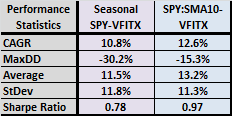
The following table compares the following five gross performance statistics associated with the preceding chart, the first two for the full sample period and the last three for full calendar years only (1994 through 2016):
- CAGR – compound annual growth rate.
- MaxDD – maximum peak-to-trough drawdown.
- Average – arithmetic average annual return.
- StDev – standard deviation of annual returns.
- Sharpe ratio – using the average monthly 3-month U.S. Treasury bill yield as the risk-free rate.
SPY:SMA10-VFITX is the winner for all performance metrics. Note that the entire sample period falls within a secular bull market for bonds (falling interest rates), favorably to both strategies.
Next, we look at the three-strategy horse race.
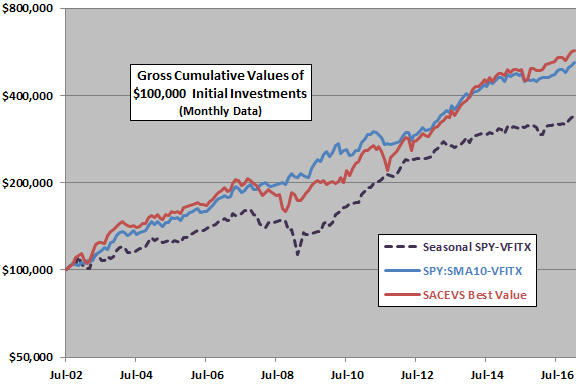
The next chart compares on a logarithmic scale gross cumulative values of $100,000 initial investments at the end of July 2002 in Seasonal SPY-VFITX, SPY-SMA10-VFITX and SACEVS Best Value. Seasonal SPY-VFITX is a clear loser. The other two are sometimes first and sometimes second.
For deeper understanding, we again compare some performance statistics.
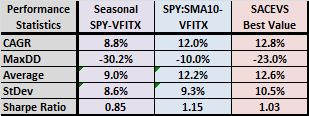
The following table compares five gross performance statistics associated with the preceding chart, the first two for the full sample period and the last three for full calendar years only (2003 through 2016). Seasonal SPY-VFITX wins on volatility. SPY:SMA10-VFITX wins on MaxDD and Sharpe ratio. SACEVS Best Value wins on both return metrics (and terminal value). Given the modest sample period, the statistics do not reveal a compelling winner, but the latter two appear preferable to the seasonal strategy.
Finally, we look at the four-strategy horse race.
The next chart compares on a logarithmic scale gross cumulative values of $100,000 initial investments at the end of July 2006 in Seasonal SPY-VFITX, SPY-SMA10-VFITX, SACEVS Best Value and SACEMS EW Top 3. Again, Seasonal SPY-VFITX finishes last (but is strong in the middle of the race). The other three end up about the same place, with SACEMS EW Top 3 mostly leading and SACEVS Best Value mostly lagging. The financial markets turbulence of 2007-2009 is a major driver of dispersion among strategies.
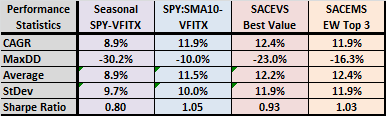
For deeper understanding, we again compare some performance statistics.
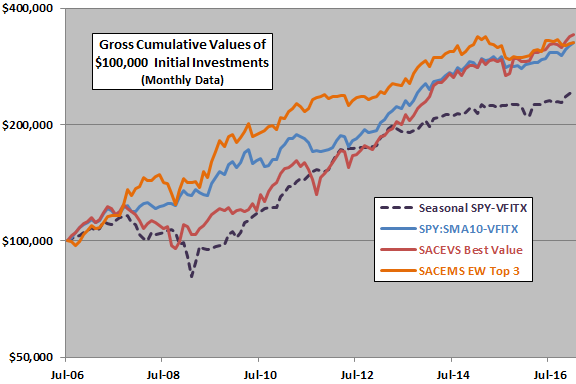
The following table compares five gross performance statistics associated with the preceding chart, the first two for the full sample period and the last three for full calendar years only (2007 through 2016). Seasonal SPY-VFITX again wins on volatility. SPY:SMA10-VFITX again wins on MaxDD and Sharpe ratio. SACEVS Best Value wins on CAGR (and terminal value). SACEMS EW Top 3 wins on average annual return and is close to the winner for Sharpe ratio. Given the very short sample period, the statistics do not reveal a compelling winner.
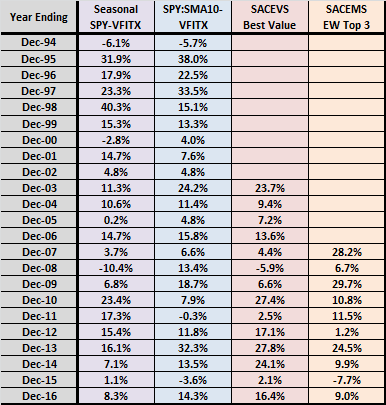
The final table, for reference, presents calendar year returns for all strategies and sample periods. Pairwise correlations of calendar year returns sample overlaps are:
- SPY:SMA10-VFITX vs. SACEVS Best Value: 0.57
- SPY:SMA10-VFITX vs. SACEMS EW Top 3: 0.55
- SACEVS Best Value vs. SACEMS EW Top 3: 0.13
Results suggest that the last pair offers the best diversification potential.
In summary, evidence from modest sample periods suggests that Seasonal SPY-VFITX is the least attractive strategy, while SPY:SMA10-VFITX, SACEVS Best Value and SACEMS EW Top 3 are competitively attractive.
Cautions regarding findings include:
- Sample periods are not long, especially for the three-strategy and four-strategy comparisons, and especially in terms of number of different interest rate environments and number of U.S. bull and bear markets.
- As noted, results are gross, not net. The first three strategies trade infrequently. SACEMS EW Top 3 carries higher trading frictions than the first three.
- While SPY:SMA10-VFITX is very competitive over available sample periods, all these periods lie within a single bond bull market. This strategy may perform less well during a period of rising interest rates.
- As described, Seasonal SPY-VFITX and SPY:SMA10-VFITX offer no escapes from both U.S. equity and U.S. interest rate risks. SACEVS Best Value offers an escape to cash when both U.S. equity and U.S. bond yields are historically low. SACEMS EW Top 3 offers escapes to cash, international equities, gold and commodities when U.S. equities and U.S. bonds have been relatively weak performers.
- The differing behaviors of the four strategies during the 2007-2009 financial crisis are material to their overall relative attractiveness. To the extent that this crisis is unique, findings may mislead about future relative attractiveness.