How diversifying are different equity factors within and across country stock markets? In his January 2016 paper entitled “The Power of Equity Factor Diversification”, Ulrich Carl analyzes diversification properties of six equity factors (market excess return, size, value, momentum, low-beta and quality) across 20 developed stock markets. He defines each factor conventionally as returns to a portfolio that is each month long (short) stocks with the highest (lowest) expected returns based on that factor. He considers: (1) cross-country correlations for each factor; (2) cross-factor correlations for each country; (3) cross-country, cross-factor correlations; (4) dynamics of cross-country correlations for each factor based on rolling 36-month windows of returns; and, (5) cross-country correlations for each factor for the 30% lowest and 30% highest market excess returns (tail events). He also applies principal component analysis as another way to evaluate how diverse the 120 country-factor return streams are. Finally, he constructs cross-factor and cross-country portfolios to assess economic value of diversification properties. Using monthly returns in U.S. dollars for the six factors in each of the 20 countries during January 1991 through April 2015, he finds that:
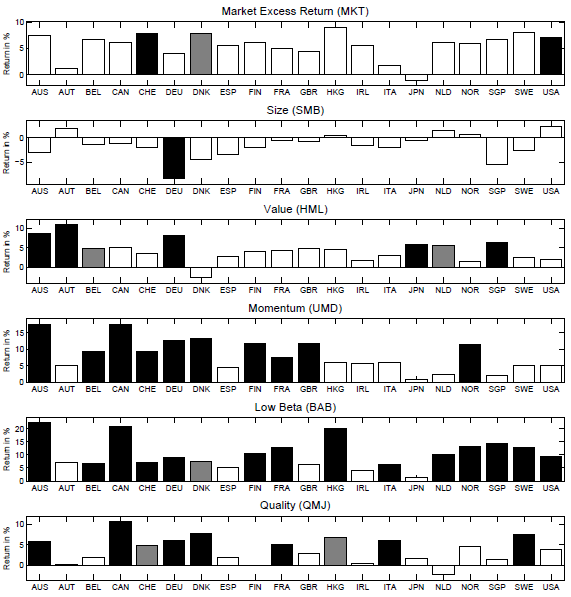
- All factors except size generate substantially positive returns in most countries (see the chart below):
- The market excess return (MKT) has median gross annualized return 6.1% across countries, ranging from -1.0% (Japan) to 9.0% (Hong Kong).
- The size factor (SMB) has median gross annualized return -1.5% across countries, ranging from -8.3% (Germany) to 2.3% (U.S.). It is positive in only 5 of 20 countries.
- The value factor (HML) has median gross annualized return 4.4% across countries, ranging from -2.9% (Denmark) to 8.6% (Austria).
- The momentum factor (UMD) has median gross annualized return 6.7% across countries, ranging from 0.9% (Japan) to 17.6% (Canada). It is significantly positive in 10 of 20 countries.
- The low beta factor (BAB) is the best-performing, with median gross annualized return 9.1% across countries, ranging from 1.5% (Japan) to 22.3% (Australia). It is significantly positive in 14 of 20 countries.
- The quality factor (QMJ) has median gross annualized return 4.2% across countries, ranging from -2.2% (Netherlands) to 10.6% (Canada). It is significantly positive in 7 of 20 countries.
- Regarding correlations:
- Over the full sample period, average pairwise correlations of factors across countries are 0.65 for MKT, 0.16 for SMB, 0.18 for HML, 0.40 for momentum, 0.21 for BAB and 0.26 for QMJ.
- Regarding rolling 36-month cross-country correlations:
- MKT trends distinctly upward with moderate cyclicality.
- Peaks at the end of the technology bubble (2001-2002) and the Euro crisis (2012) dominate HML cyclicality.
- UMD trends upward, with peaks at the end of the technology bubble and especially during recovery from the financial crisis (2009-2010).
- BAB also peaks at the end of technology bubble.
- MKT cross-country correlation for the top (bottom) 30% of returns is 0.34 (0.54), indicating elevated correlation during crises. QMJ shows some increase in correlation during bad times. Other factors do not.
- Across factors, QMJ and UMD attractively diversify MKT. HML and UMD do not stand out as mutually diversifying, though the construction of the HML may be key to that non-finding. These correlations exhibit no trends during the sample period.
- 33 principal components are needed to explain more than 80% of the variation in the 120 country-factor returns, indicating large diversification potential
- France, Great Britain, Germany and the U.S. (Ireland, Australia, Japan, Singapore and Hong Kong) exhibit relatively high (low) overall cross-country correlations.
- Regarding implications for risk parity portfolios (all assets contributing equally to portfolio volatility):
- International diversification for each factor reduces portfolio volatility by 50%-60% for factors with low cross-country correlations (SMB, HML, BAB and QMJ) and by 20% for MKT and 39% for UMD. The volatility reductions translate to an average doubling of gross Sharpe ratio compared to single-country investing.
- Diversifying across factors within each of the 20 countries also significantly reduces volatilities (with reductions ranging from 53% in the U.S. to 72% in GBR) and boosts gross Sharpe ratios compared to single-factor investing.
The following chart, taken from the paper, summarizes annualized returns in U.S. dollars over the full sample period for the six equity factors (MKT, SMB, HML, UMD, BAB and QMJ) in each of 20 developed markets. The twenty countrries are Australia (AUS), Austria (AUT), Belgium (BEL), Canada (CAN), Switzerland (CHE), Germany (DEU), Denmark (DNK), Spain (ESP), Finland (FIN), France (FRA), Great-Britain (GBR), Hong Kong (HKG), Ireland (IRL), Italy (ITA), Netherlands (NLD), Norway (NOR), Singapore (SGP), Sweden (SWE) and the United States (USA). Black (gray) shading indicates statistical significance at the 5% (10%) level. Results indicate considerable variation across factors and markets.
In summary, evidence indicates large potential diversification benefits for diversifying stock factor portfolios across countries and country stock portfolios across factors.
Cautions regarding findings include:
- Factor returns are gross, not net. Accounting for costs of monthly portfolio reformation and shorting would reduce factor returns. These costs vary by factor and country, such that net interactions may differ from gross interactions. Shorting may not always be feasible as specified.
- The method of combining factors within countries ignores the potential for netting trades and eliminating stocks with conflicting factor values, per “Integrated Approach to Factor Investing”.
- Some factors in some countries may offer little investment capacity.
- The sample is not long in terms of number of market cycles and trends in globalization of markets.