Do attention-driven retail stock investors bid prices of the biggest daily movers to overvaluation? In their March 2017 paper entitled “Daily Winners and Losers”, Alok Kumar, Stefan Ruenzi and Michael Ungeheuer examine the subsequent return behaviors of the biggest daily winning and losing stocks. Specifically, they each day identify the 80 stocks with the highest daily returns (winners) and the 80 stocks with the lowest daily returns (losers). Each month, they group stocks as:
- Winners – a daily winner, but not a daily loser, at least once during the prior month.
- Losers – a daily loser, but not a daily winner, at least once during the prior month.
- Both – a daily winner and a daily loser at least each once during the prior month.
- Never – not a daily winner or a daily loser during the prior month.
They then reform monthly value-weighted and equal-weighted portfolios of the groups to measure performance differences. Using daily returns and characteristis for a broad sample of U.S. common stocks with price above $5, along with stock factor model returns, during July 1963 through December 2015, they find that:
- On average over the sample period, 5.7%, 8.0% and 5.0% of stocks are daily Winners, Losers and Both, respectively.
- On average by month, Never (Both) stocks comprise about 93% (1.1%) of market capitalization.
- Average gross value-weighted (equal-weighted) monthly portfolio returns are:
- -0.17% (0.38%) for Winners.
- 0.39% (0.20%) for Losers.
- -1.07% (-0.90%) for Both.
- 0.53% (0.82%) for Never.
- A Never-Minus-Both, or NMB, hedge portfolio that is each month long the Never portfolio and short the Both portfolio on a value-weighted (equal-weighted) basis generates:
- Average gross monthly return 1.60% (1.72%).
- Gross annualized Sharpe ratio 0.77 (1.32).
- Gross monthly 4-factor (market, size, book-to-market, momentum) alpha 1.75% (1.76%).
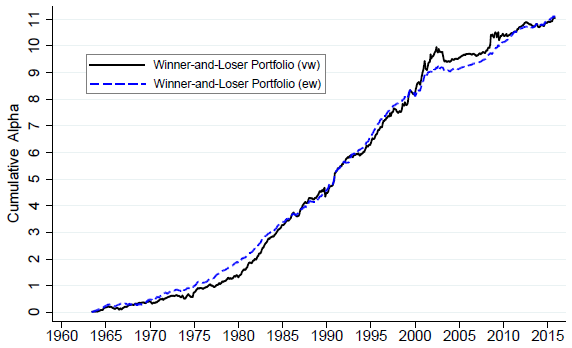
- Delivers almost constantly positive alpha (see the chart below).
- Underperformance of biggest winners and losers persists for many months. A value-weighted (equal-weighted) NMB portfolio held for three years generates gross cumulative 4-factor alpha 17% (15%).
- NMB portfolio returns relate negatively to market factor and size factor returns and positively to value factor returns.
- Available trading data suggest that retail investors buy extreme daily winners and losers, while institutional investors sell or short, (providing liquidity, but not enough to satisfy demand).
- The effect is strongest:
- Using close-to-close daily returns.
- For stocks with high retail ownership and are therefore likely hard to short (but is still significant for more liquid stocks).
- When investor sentiment is high.
- The negative return premium associated with high-volatility stocks concentrates among the biggest movers. It is not significant for Never stocks.
- Findings are generally robust to:
- Controlling for a broad set of risk factors and stock characteristics, including idiosyncratic volatility and last-month maximum daily return.
- Using biggest mover cutoff levels other than top 80 and bottom 80.
- Retaining stocks priced $5 or less in the sample.
- Inserting a one-month gap between identification of biggest movers and NMB portfolio formation.
The following chart, taken from the paper, tracks cumulative 4-factor alphas of the NMB hedge portfolio (Winner-and-Loser Portfolio here) with value-weighted (vw) or equal-weighted (ew) sides over the full sample period. The strategy delivers almost constantly positive alpha. Cumulative alphas for value weighting and equal weighting are very similar.
In summary, evidence indicates that a hedge strategy that sells recent biggest movers (both up and down) and buys other stocks may be attractive.
Cautions regarding findings include:
- Reported results are gross, not net. Accounting for monthly portfolio reformation and shorting costs would reduce performance. Moreover:
- Trading frictions (particularly impact-of-trading, given the capacity constraint) may be exceptionally high for Both stocks.
- Shorting may be costly or infeasible for some Both stocks.
- Identifying proxy funds for Never stocks may be problematic.
- The capacity constraint for Both suggests infeasibility for large traders.