What’s the best way to combine profitability and value in screening stocks? In their April 2017 paper entitled “The Magic Formula: Value, Profitability, and the Cross Section of Global Stock Returns”, Douglas Blackburn and Nusret Cakici compare performances of a portfolio based on the Magic Formula (MF) and a portfolio based on an Improved Magic Formula (IMF). Both portfolios are long profitable value (PV) stocks and short unprofitable growth (UG) stocks. For MF, profitability is return-on-capital, defined as earnings before interest and taxes (EBIT) divided by tangible capital. For IMF, profitability is gross profitability, gross profit divided by assets. For both, value is an earnings yield, defined as EBIT divided by enterprise value. Specifically, they each month reform a PV-UG portfolio by:
- Ranking stocks by the profitability metric seven months ago (ensuring availability of all inputs).
- Ranking stocks by earnings yield seven months ago.
- Adding the two rankings and sorting stocks into fifths (quintiles) by combined rank.
- Buy the top quintile, sell the bottom quintile (PV-UG) and hold for one month, employing either equal weighting or value weighting.
They test PV-UG portfolios separately in developed equity markets grouped into North America, Europe, Japan and Asia regions. Using the specified firm data and associated monthly stock excess returns (relative to the 1-month U.S. Treasury bill yield as the risk-free rate) in U.S. dollars for 23 developed stock markets during January 1991 through December 2016, they find that:
- MF PV-UG portfolios mostly fail to generate attractive performance over the sample period. Average monthly gross excess returns are:
- In North America, ‐0.36% (0.29%) for equal (value) weighting.
- In Europe, 0.95% (0.59%) for equal (value) weighting, with significant gross 4-factor (market, size, book-to-market and momentum) monthly alpha for equal weighting of 0.67%.
- In Japan, ‐0.03% (0.11%) for equal (value) weighting.
- In Asia, 0.09% (0.41%) for equal (value) weighting, with significant monthly gross 4-factor alpha for value weighting of 0.66%.
- IMF PV-UG portfolios consistently generate attractive performance over the sample period. Average monthly gross excess returns are:
- In North America, 0.79% (0.88%) for equal (value) weighting, with significant monthly gross 4-factor alpha 0.95% (1.19%).
- In Europe, 0.87% (0.65%) for equal (value) weighting, with significant 4-factor monthly gross alpha 0.75% (0.45%).
- In Japan, 0.40% (0.66%) for equal (value) weighting, with significant 4-factor monthly gross alpha 0.36% (0.53%).
- In Asia, 0.09% (0.41%) for equal (value) weighting, with significant monthly gross 4-factor alpha for value weighting of 0.82%.
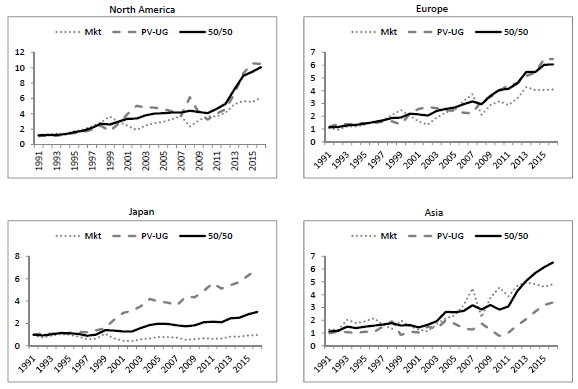
- The IMF value-weighted PV‐UG portfolios for North America, Europe, Japan and Asia have respective market betas ‐0.40, ‐0.19, ‐0.07 and ‐0.53, suggesting that they diversify their markets. Annualized gross Sharpe ratios for the value-weighted market, the value-weighted PV-UG and a monthly rebalanced 50/50 combination of the value-weighted market and the value-weighted PV-UG are (see the charts below):
- 0.50, 0.49 and 0.97 in North America.
- 0.39, 0.54 and 1.02 in Europe.
- 0.10, 0.69 and 0.43 in Japan.
- 0.34, 0.31 and 0.62 in Asia.
- IMF PV‐UG portfolio average monthly gross excess returns are large and statistically significant for both big and small stocks, though larger for small stocks.
The following charts, taken from the paper, track cumulative gross values of $1 investments at the beginning of 1991 in each of three stock portfolios by region:
- Mkt – value‐weighted market.
- PV‐UG – value-weighted, based on IMF.
- 50/50 – an equally weighted combination of Mkt and IMF PV-UG, rebalanced monthly.
50/50 portfolios beat associated Mkt portfolios in every region and are generally smooth through crises. For example, during the financial crisis in 2008, Mkt portfolios in North America, Europe, Japan and Asia suffer drawdowns of ‐37%, ‐43%, ‐27% and ‐50%, respectively, but PV‐UG portfolios gain 65%, 44%, 21% and 38%. Corresponding 50/50 portfolio returns during 2008 are 5.7%, ‐7.0%, ‐4.7% and ‐10.7%.
In summary, evidence indicates that substituting gross profitability for return-on-capital greatly improves the performance of the Magic Formula.
Cautions regarding findings include:
- All performance data are gross, not net. Accounting for monthly portfolio reformation frictions and shorting costs would reduce returns. Shorting of some stocks as specified may be problematic due to lack of shares to borrow.
- Testing two strategies in four markets introduces snooping bias (luck), such that the best-performing combination overstates expectations. There may be additional snooping bias inherited from research motivating the investigation.
- The IMF PV-UG strategy as specified is impractical for most individuals, who would bear fees for delegating execution to a fund manager.
See also: