Are equity sector and factor investing complementary? In their May 2017 paper entitled “Factors vs. Sectors in Asset Allocation: Stronger Together?”, Marie Briere and Ariane Szafarz compare efficient sector investing (diversifying economic risks) and efficient factor investing (diversifying across risk factors) for U.S. stocks, and then assess advantages of combining the two approaches. They first construct two efficient frontiers (sets of portfolios with the highest expected returns across the range of volatilities), one from 10 sectors and the other from 10 factors. Their sector set consists of long-only portfolios covering (1) non-durable consumer goods, (2) durable consumer goods, (3) manufacturing, (4) energy, (5) technology, (6) telecommunications, (7) shops, (8) health care, (9) utilities and (10) other. Their factor set consists of the long and short portfolios separately for (1) size, (2) book-to-market, (3) momentum, (4) profitability and (5) investment. They consider six scenarios consisting of three samples (full period, crisis subperiods and non-crisis subperiods) for long-only and long-short efficient portfolios. They define crises by combining NBER recession dates and Forbes Magazine bear market dates. Using monthly returns for sectors and factors as specified from Kenneth French’s data library and the broad market, along with yields for 1-month U.S. Treasury bills as the risk-free rate, during July 1963 through December 2016, they find that:
- Among sectors:
- Average annualized gross returns range from 10.0%, 10.2% and 10.5% for utilities, durables and telecommunications, respectively, to 12.8% for health care and 12.9% for non-durables.
- Annualized volatilities range from 13.9% for utilities to 22.3% for technology.
- Annualized gross Sharpe ratios range from 0.45 for durables to 0.85 for non-durables.
- Health care and non-durables generate significantly positive market alphas.
- Average pairwise correlation of monthly returns is 0.65.
- Among factors:
- Average annualized gross returns range from 8.3% for the momentum short side to 15.2% for the book-to-market long side.
- Annualized volatilities range from 15.0% for the size short side to 21.6% for the momentum short side.
- Annualized gross Sharpe ratios range from 0.37 for the momentum short side to 0.87 for the momentum long side.
- Six of 10 factor portfolios generate significantly positive market alphas (all five long sides and the size short side).
- Average pairwise correlation of monthly returns for factors is 0.92.
- For a sector-factor horse race, on a gross basis:
- When short selling is prohibited/infeasible, sector investing is preferable for investors with low to moderate risk tolerance, and factor investing is preferable for investors with very high risk tolerance (see the first chart below). Factor investing is dominantly preferable when short-selling is allowed/feasible (see the second chart below).
- Sector investing is generally less risky (volatile) than factor investing.
- As indicated by average pairwise correlations above, sector investing offers more diversification potential than factor investing.
- Combination strategies exploiting both sector and factor diversification outperform the separate strategies except for long-only investors seeking either very low or very high risk (see the charts below).
- Improvement is greatest during crises when shorting is allowed/feasible.
- For long-only portfolios, factor investing enhances returns by delivering alphas during calm times but does not hedge against crises.
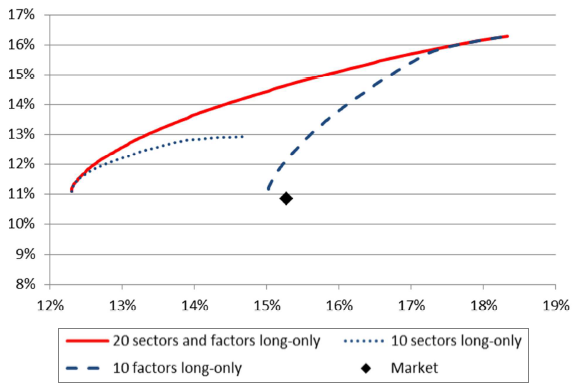
The following charts, taken from the paper, depict gross annualized return versus volatility (standard deviation of returns) of efficient frontier portfolios of the 10 sectors (dotted blue), the 10 long and short factors (dashed blue) and all 20 portfolios combined (solid red) over the full sample period.
The first chart shows results for a long-only constraint. This chart indicates that:
- Sector portfolios are preferable for investors with low to moderate risk tolerance.
- Factor portfolios are preferable for investors with very high risk tolerance.
- Combination portfolios (10 sectors and five long factors) are preferable for all investors except those with very low or very high risk tolerance.
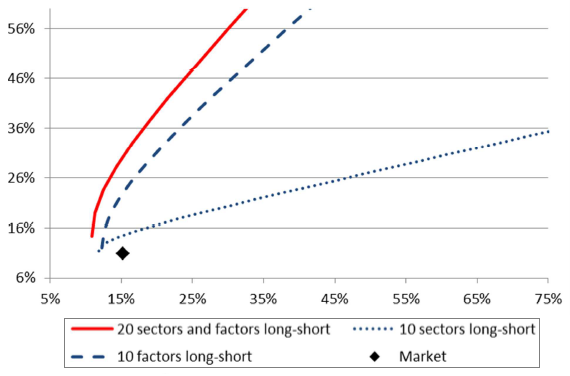
The second chart shows results when shorting is allowed and feasible as specified for the five factor short-side portfolios. This chart indicates that:
- Factor portfolios dominate sector portfolios.
- The combination portfolio (10 sectors and 10 factors) dominates the sets of sector and factor portfolios.
In summary, evidence indicates that portfolios made up of both sectors and factors are, on a gross basis, attractive: (1) generally for long-short investors;and, (2) for many moderately risk-averse long-only investors.
Cautions regarding findings include:
- As noted, findings are gross, not net. Net findings may differ from gross findings because:
- Sector and factor portfolios are index-like and do not include costs of maintaining liquid investment vehicles. Accounting for these costs would reduce returns. These costs are likely much higher for factor than sector portfolios due to higher turnovers.
- Short-side factor portfolios may be infeasible to some degree due to lack of shares to borrow for some stocks, driving up the cost of or precluding short positions.
- Costs of monthly rebalancing to maintain multi-sector and multi-factor efficient portfolios would also reduce returns. These costs may differ across sectors and factors.
- Leverage is implicit in constructing some efficient portfolios, and the cost of leverage assumed in the study may be unrealistically low for some investors.
- Maintaining factor portfolios and efficient frontier portfolios is beyond the reach of many investors, who would bear fees for delegating these tasks to investment/fund managers.
- Economic recessions and bear markets are known only after-the-fact, so capturing sector-factor diversification benefits associated with these states is problematic.
- Findings may differ in other markets.
See also the closely related “Sector vs. Factor U.S. Stock Diversification?”.