Is recent Fama-French 5-factor alpha (accounting for market, size, book-to-market, profitability and investment risks) a useful predictor of U.S. equity sector performance? In other words, is there an alpha momentum anomaly at the sector level? In their June 2017 paper entitled “US Sector Rotation with Five-Factor Fama-French Alphas”, Golam Sarwar, Cesario Mateus and Natasa Todorovic examine 5-factor alphas of U.S. equity sectors and test both long-only and long-short sector rotation strategies based on 36-month alpha ranking. They conduct long-sample conceptual tests on 10 Fama-French U.S. sector (or industry) portfolios and short-sample tests on S&P Select Sector SPDR exchange-traded funds (ETF). Specifically, they each month measure rolling alpha for each sector based on the last 36 months of returns, and:
- Long-only strategy – Each month take equal positions in sectors with positive alphas at the end of the prior month.
- Long-short strategy – Each month take equal long (short) positions in sectors with positive (negative) alphas at the end of the prior month.
- Alternative long-only strategy – (1) each month during U.S. economic expansions (per NBER), take equal positions in sectors with positive alphas at the end of the prior month; and, (2) each month during U.S. economic contractions, hold 1-month U.S. Treasury bills (T-bills).
They also compare effectiveness of Fama-French 3-factor model versus 5-factor model for analysis of sector returns. Using monthly returns for Fama-French sectors and factor models, monthly returns for the S&P 500 Index and T-bill yields since January 1964, and monthly returns for sector ETFs since January 1999, all through December 2014, they find that:
- For the long-term data, the 5-factor model fits returns of U.S. sector portfolios more accurately than the 3-factor model, but all the sectors still have significant 5-factor alphas at times. For the full sample, half the sectors generate significant 5-factor alphas. More specifically:
- Across all 10 sectors, the average gross annualized alpha is 3.15%.
- Highest average alphas are for high technology (37%) and healthcare (38%), while the lowest is for consumer durables (-25%).
- Sector alphas vary considerably over time.
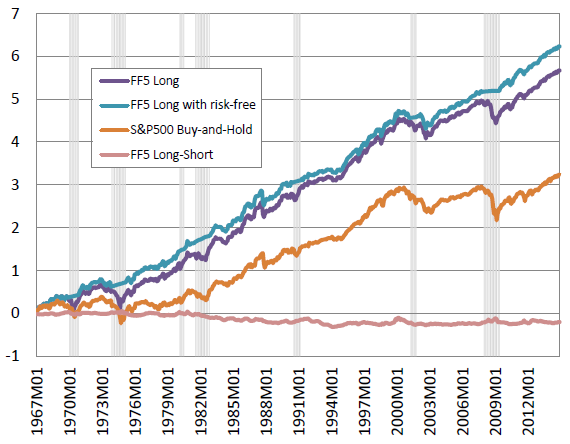
- For the long-sample rotation strategies using Fama-French sector portfolios (see the chart below), average gross annualized returns, annualized standard deviations of returns and gross monthly Sharpe ratios are, respectively:
- S&P 500 Index: 5.7%, 15.5% and 0.03.
- Long-only: 11.1%, 15.8% and 0.12.
- Long-short: -0.5%, 4.4% and -0.35.
- Alternative long-only: 12.8%, 13.2% and 0.17.
- For the short-sample rotation strategies using sector ETFs, average gross annualized returns, annualized standard deviations of returns and gross monthly Sharpe ratios are, respectively:
- S&P 500 Index: 2.0%, 16.9% and 0.03.
- Long-only: 5.5%, 16.3% and 0.08 (breakeven switching frictions 1.5%).
- Long-short: 0.5%, 7.3% and -0.05.
- Alternative long-only: 9.2%, 13.8% and 0.16 (breakeven switching frictions 3.3%).
The following chart, taken from the paper, tracks cumulative returns of the three sector rotation strategies based on rolling 36-month Fama-French 5-factor (FF5) alpha momentum as applied to 10 Fama-French sector portfolios. It also shows cumulative return of the S&P 500 Index as a benchmark. “Long” is long-only as specified above. “Long with risk-free” is alternative long-only as specified above. Results indicate that long-only sector rotation is attractive, but long-short rotation does not work.
In summary, evidence suggests that there may be some value to long-only U.S. equity sector rotation based on high recent 5-factor alpha.
Cautions regarding findings include:
- Because sectors on average outperform the S&P 500 Index, average sector return is arguably a more appropriate benchmark than the broad stock market to distinguish between general sector performance versus incremental value of alpha momentum (as done in “Simple Sector ETF Momentum Strategy”).
- Failure of the long-short strategy suggests that sectors with low recent alphas perform as well as those with high recent alphas, undermining belief in usefulness of alpha momentum.
- The alternative long-only strategy introduces severe look-ahead bias (requires perfect foresight), because NBER assigns expansion and contraction dates well after the fact. For example, announcement of the end of the last contraction in June 2009 is in late September 2010.
- Strategies are data/calculation-intensive and beyond the reach of most investors, who would bear fees for delegating to an investment manager/fund.
- The Fama-French sector portfolios are essentially indexes. They do not account for costs of maintaining liquid funds.
- Although the study reports some breakeven portfolio reformation frictions, returns and Sharpe ratios are gross of frictions and shorting costs.
- The authors apparently ignore dividends, which differ across sectors and may decisively affect returns and alphas.
- There may be snooping bias in the selection of a 36-month alpha lookback interval.
- The sector ETF sample is very short for the the methodology used (only five independent 3-year alpha lookback intervals).