How well do stock index covered call strategies work across markets worldwide? In their June 2017 paper entitled “Covering the World: Global Evidence on Covered Calls”, Roni Israelov, Matthew Klein and Harsha Tummala test covered call strategies for 11 global equity indexes. They measure overall returns and return contributions from equity exposure, short volatility exposure and equity timing. They also test a risk-managed covered call strategy that sells at-the-money covered calls with hedging of estimated dynamic equity exposure deviations from 0.5 (from an option pricing model) using index futures. Using call options data for the 11 equity indexes as available (all by January 2006) through September 2015, along with associated index values and futures returns, they find that:
- On average, equity index covered calls deliver lower raw but higher risk-adjusted returns than underlying indexes. Based on all available data (varying start dates), average gross performance statistics for covered calls (underlying indexes) worldwide are:
- 6.6% (7.2%) annualized excess return.
- 14.8% (21.2%) annualized volatility.
- 0.45 (0.33) annualized Sharpe ratio.
- 5.4% (4.5%) compound annual excess return.
- -45% (-63%) maximum drawdown.
- Across indexes worldwide, risk and return contributions of equity exposure (highest, most volatile return), short volatility exposure (highest Sharpe ratio) and equity timing (no return contribution) are very consistent. Average gross performance statistics are (see the chart below):
- For equity exposure, 3.6% annualized return, 11.5% annualized volatility and annualized Sharpe ratio 0.31, with average cross-index correlation 0.7.
- For short volatility, 1.9% annualized return, 2.7% annualized volatility and annualized Sharpe ratio 0.74, with average cross-index correlation 0.4.
- For equity timing, -0.3% annualized return and 5.6% annualized volatility (risk with no return), with average cross-index correlation 0.4.
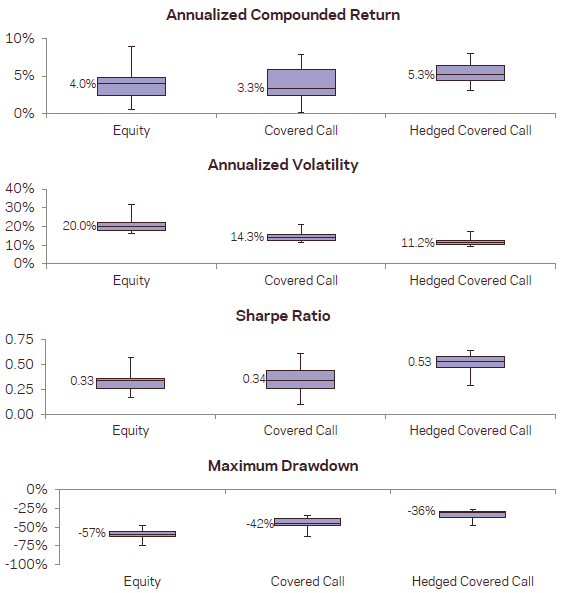
- The risk-managed covered call strategy offers some improvements in gross performance. Based on a common start date of January 2006 (when all series are first available), average gross performance statistics for risk-managed covered calls (unmanaged covered calls) worldwide are:
- 5.9% (5.3%) annualized excess return.
- 11.7% (14.7%) annualized volatility.
- 0.51 (0.35) annualized Sharpe ratio.
- 5.4% (4.0%) compound annual excess return.
- -35% (-44%) maximum drawdown.
- Weighting by equity index world capitalization share rather than equally has modest effects on performance statistics. Based on a common start date of January 2006, capitalization-weighted (simple average) gross performance statistics for risk-managed covered calls worldwide are:
- 5.5% (5.9%) annualized excess return.
- 9.7% (11.7%) annualized volatility.
- 0.57 (0.51) annualized Sharpe ratio.
- 5.3% (5.4%) compound annual excess return.
- -33% (-35%) maximum drawdown.
- Regarding trading frictions:
- Frictions for selling call options each month are about 0.28% per year, thereby decreasing average Sharpe ratio for the equally weighted basic strategy from 0.35 to 0.33 (compared to 0.32 for underlying indexes).
- Adding estimated frictions for daily hedge adjustments decreases average Sharpe ratio for the equally weighted risk-managed strategy from 0.51 to 0.46.
The following chart, taken from the paper, graphically summarizes average gross performance statistics for the 11 underlying equity indexes (Equity), the associated basic covered call strategy (Covered Call) and the associated risk-managed covered call strategy (Hedged Covered Call) based on a common start date of January 2006 for all indexes (when they are first all available). On a gross basis, the risk-managed covered call strategy wins for all statistics.
In summary, evidence indicates that investors may be able to beat a portfolio of worldwide equity indexes with a portfolio of associated risk-managed covered call positions.
Cautions regarding findings include:
- Most of the statistics presented are gross of implementation frictions. The estimates of frictions presented may be low for some investors and may vary by index.
- The risk-managed covered call strategy is likely beyond the reach of many investors, who would bear fees for delegating to an investment/fund manager.
See also: