“Usefulness of P/E10 as Stock Market Return Predictor” investigates whether P/E10 (or Cyclically Adjusted Price-Earnings ratio, CAPE) usefully predicts U.S. stock market returns over the long run. That analysis employs Robert Shiller’s data set, which defines P/E10 as inflation-adjusted S&P Composite Index level divided by average monthly inflation-adjusted 12-month trailing earnings of index companies over the last ten years. Do more timely country P/E10 series work for timing country stock markets and trading pairs of country stock markets? Within each country market, higher (lower) P/E10 suggests overvaluation (undervaluation). Across countries, variation in P/E10 gaps arguably indicates which country markets are relatively overvalued and undervalued. To investigate, we consider:
- P/E10 time series for Germany, Japan and the U.S. evaluated separately over available sample periods using DAX, Nikkei 225 and S&P 500 indexes, respectively. We also look at separately timing SPDR S&P 500 (SPY) and iShares MSCI Japan (EWJ).
- Japan P/E10 versus U.S. P/E10 for pair trading of SPY versus EWJ over the available sample period.
Using monthly data for the three P/E10s, the three associated stock market indexes, SPY, EWJ and 3-month U.S. Treasury bill (T-bill) yield as available during December 1981 through December 2017, we find that:
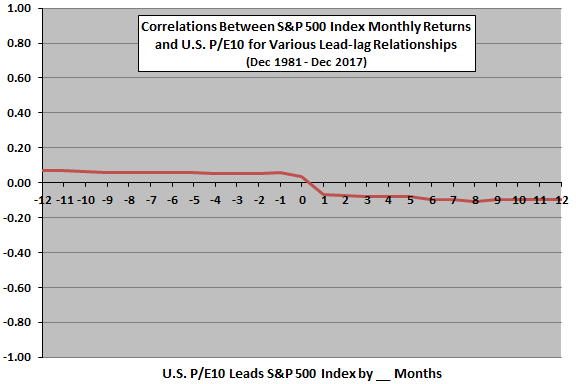
The following chart summarizes correlations for lead-lag relationships between S&P 500 Index monthly return and monthly U.S. P/E10 over the available sample period, ranging from stock market return leads P/E10 by 12 months (-12) to P/E10 leads stock market return by 12 months (12). Notable points are:
- Naturally, stock market return positively leads P/E10 at horizons of 1 to 12 months. In other words, higher (lower) stock prices drive higher (lower) levels of P/E10.
- P/E10 leads stock market return negatively at horizons of 1 to 12 months. In other words, higher (lower) levels of P/E10 tend to precede lower (higher) stock market returns.
- Persistence of effects suggests that relationships are very long term, and monthly measurements/investor reactions may not be useful.
Results for the Japanese and German markets are very similar.
To test short-term non-linear effects, we look at average S&P 500 Index future monthly returns by range of U.S. P/E10.
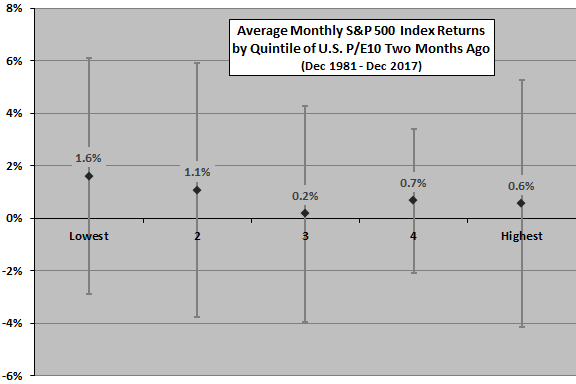
The next chart summarizes average S&P 500 Index returns by ranked fifth (quintile) of U.S. P/E10 two months prior (to accommodate the P/E10 release schedule) over the available sample period, with one standard deviation variability ranges. Notable points are:
- Low P/E10s precede higher average stock market returns than high P/E10s, but the relationship is not completely systematic. The lowest average return is for the middle quintile.
- Returns after high P/E10s are appreciable, potentially confounding market timing.
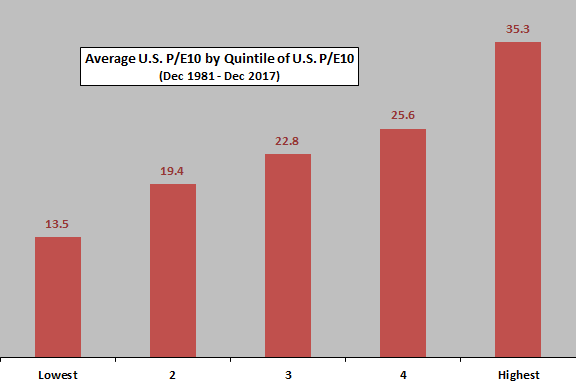
What are levels of P/E10 associated with these quintiles?
The next chart summarizes average U.S. P/E10 by quintile of P/E10 over the available sample period. Low (high) P/E10s are in the teens (thirties).
How might findings translate to timing of individual stock markets?
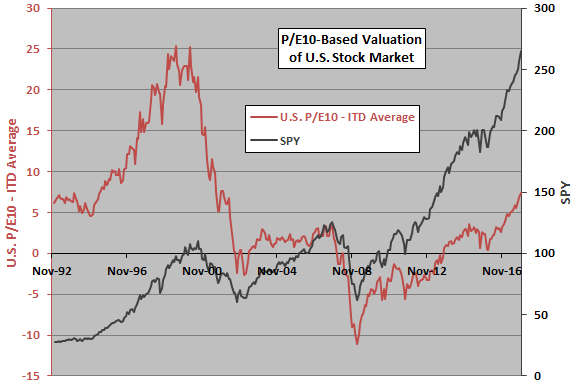
The next chart tracks the difference between current U.S. P/E10 and inception-to-date (ITD) average U.S. P/E10 through the prior month since inception of SPY. A positive (negative) value of this variable may mean that the U.S. stock market is overvalued (undervalued). Based on this interpretation, the only sustained subperiod of undervaluation is January 2008 through September 2013. For reference, the chart includes the trajectory of SPY.
There may be no stable mean to which the valuation series reverts.
How does this interpretation translate into market timing performance?
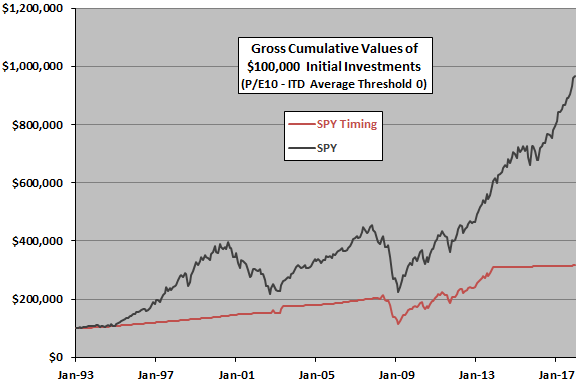
The next chart tracks performance of a strategy that holds SPY (T-bills) when U.S. P/E10 two months ago is below (above) its ITD average. As a benchmark, the chart includes the performance of buying and holding SPY. Timing is ineffective. The strategy holds T-bills 75% of the time. Results suggest that P/E10 is far from sufficient for timing based on monthly signals with so short a history.
What about timing the Japanese stock market?
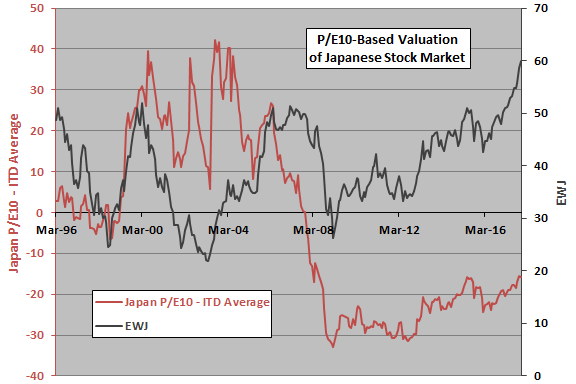
The next chart tracks the difference between current Japanese P/E10 and ITD average Japanese P/E10 through the prior month since inception of EWJ. A positive (negative) value of this variable may mean that the Japanese stock market is overvalued (undervalued). Based on this interpretation, the market is mostly overvalued during the first half of the sample period and undervalued during the second half. For reference, the chart also includes the trajectory of EWJ.
Again, there may be no stable mean to which the valuation series reverts.
How does this interpretation translate into market timing performance?
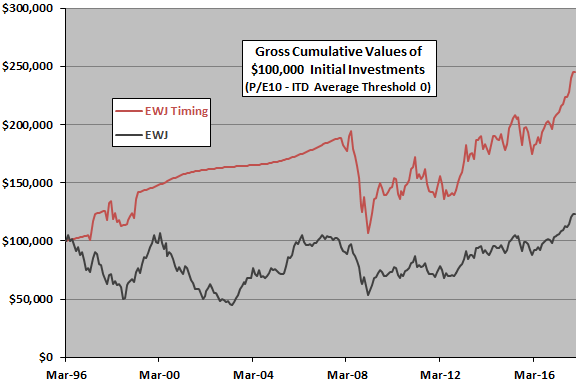
The next chart tracks performance of a strategy that holds EWJ (T-bills) when Japanese P/E10 two months ago is below (above) its ITD average. As a benchmark, the chart includes the performance of buying and holding EWJ. Timing in this case is effective, though performance is not compelling for a 20-year investment. The strategy is out of stocks for most of the 2000s.
What about pair trading of country stock markets based on relative valuations?
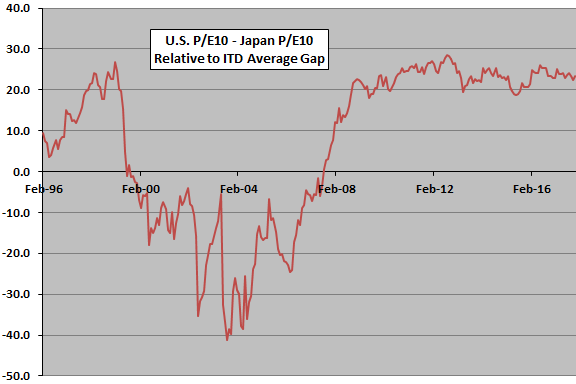
The next chart tracks the gap between U.S. P/E10 and Japanese P/E10 minus the average value of that gap through the prior month since the inception of EWJ. A positive (negative) value may mean that the U.S. stock market is overvalued (undervalued) relative to the Japanese stock market. Based on this approach, the Japanese market is undervalued relative to the U.S. market for all except July 1999 through July 2007.
Again, there may be no stable mean to which the relative valuation series reverts.
How does this interpretation translate into pair trading performance?
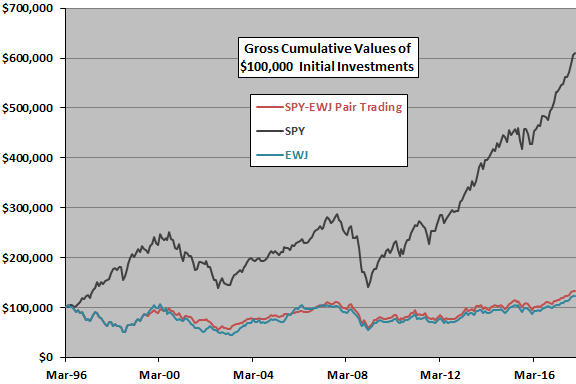
The final chart tracks performance of a SPY-EWJ pair trading strategy that is in SPY (EWJ) when the variable in the preceding chart is negative (positive). For reference, the chart also shows the performances for buying and holding SPY and EWJ. Results show that that pair trading approach is ineffective.
In summary, evidence from simple tests on available data offer little support for belief that P/E10 by itself is useful for country stock market timing or country stock market picking based on monthly data.
Cautions regarding findings include:
- The sample period is extremely short in terms of number of independent 10-year earnings cycles (less than four).
- As noted, performances of timing and pair trading strategies are gross, not net. However, the numbers of trades are small.
- Other parameter values for, or other approaches to, time series and pairs trading may work better. Pairs trading may work better for other pairs of country stock markets. Experimentation invites data snooping bias, such that the most attractive alternatives overstate expectations.
In addition to “Usefulness of P/E10 as Stock Market Return Predictor”, see also “Alternative Tests of P/E10 Usefulness”.