A reader asked: “Could you review the track record of MarketTrak? Their timing is based on neural network technology and looks at first glance reasonable. Is there any evidence that a neural network provides an edge in market timing?”
The site states: “MarketTrak publishes a highly accurate forecast of the stock market direction for one and five days ahead.” The site does not quantify forecast accuracy, but has a rolling promotional blurb at the top of the home page which states: “Profit YTD is 50+ percent December 9, 2009.” There is no explanation regarding the method or assumptions used in calculating that profit.
The overview of the MarketTrak forecast model briefly describes use of “an advanced neural network model in combination with a genetic algorithm to calculate a DJIA forecast.” The overview does not present accuracy statistics for model outputs.
A web search reveals a trading position history, which lists the “computed trading position at the close for the next trading day” over the period 11/11/04 through 11/20/08 (1,014 trading days). However, there is not enough information in the document to tell whether it is a backtest or a record of live forecasts. If it is a backtest constructed from experimental selection of model specifications and parameter settings, data snooping bias could be substantial. Return calculations for such a test should be based on a tradable asset like DIAMONDS Trust, Series 1 (DIA) rather than DJIA, and apparently should be based on open-to-close rather than close-to-close at least part of the time. The indicated number of position changes in the sample (265) would involve material trading frictions. Based on some rough assumptions:
Using close-to-close returns for DIA, the document indicates average daily profitability as long as per-trade friction is below 0.8%.
Using open-to-close returns for DIA, the document indicates average daily profitability as long as per-trade friction is below 0.6%.
The MarketTrak disclaimer states:
“We strive to make our forecast the best available, but we do not guarantee its accuracy or profitability. We provide the forecast on an “as is” basis without any warranty of any kind. Specifically, MarketTrak disclaims any and all warranties, expressed or implied, including without limitation warranties of merchantability, profitability, and fitness for a particular purpose.”
“Stock Picking in a ‘Fruit Fly Lab'” describes some formal research on the application of genetic algorithms to stock trading, concluding that “knowledgeable humans applying sophisticated programming techniques may be able beat the market.” The market knowledge of the humans designing the program appears to be both critical and imprecisely specified. Most available research indicates stock picking is more likely to drive outperformance than market timing.
In summary, there is not enough information available to assess the value of the MarketTrak service with reasonable confidence. Data snooping bias is a principal concern.
Via the MarketTrak contact email address, Rich Pryor commented: “…the 1014 [trading day] forecast results were mostly backtesting. The last 200 were blind forward projections. The 50 + return was totally blind. If you open an account, I will be glad to give you a free 3-month subscription. You can use this time to judge the merits of my model.”
Response:
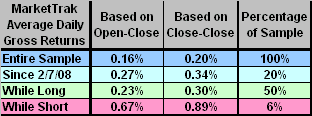
Here are some MarketTrak average daily gross return performance metrics, with observations as follows:
- Gross performance during the last 200 trading days in the sample (involving 55 position changes) is better than that in the overall sample, but involves only a bear market regime. Timing systems (even those that generate signals randomly) have an inherent advantage over a buy-and-hold strategy during bear markets, and an inherent disadvantage during bull markets.
- A realistic trading scenario would probably have gross returns somewhere between the Open-Close and Close-Close results, less trading frictions that depend on account size and specific broker fees.
- In the overall sample, gross performance while short is stronger than gross performance while long, but there are generally incremental borrowing costs for short positions.
CXOadvisory.com use only publicly available data for reviews (no private trials), so that readers can check the results if they choose. It is preferable that reviews involve “live” data spanning at least two years to encompass potentially real trading under different kinds of market conditions.
