An investor recently obtained from the Securities and Exchange Commission (SEC) via the Freedom of Information Act a daily record over an extended period of aggregate Fails-to-Deliver (FTDs) known to the agency for NovaStar Financial Inc. (NFI). FTDs occur when brokers do not match short sales with shares to borrow within a specified number of business days. NFI investor Millerd1 suggested that there should be relationships between the FTDs for NFI and its total short interest, stock trading volume and stock price. Here are three hypotheses to test:
Hypothesis (1): Total short interest in the stock should move up and down with FTDs. In other words, there should be a positive correlation between short interest and FTDs.
Hypothesis (2): The stock price should decrease (increase) when FTDs increase (decrease), because creating (eliminating) FTDs effectively increases (decreases) the supply of shares without changing the demand for shares. In other words, there should be a negative correlation between stock price and FTDs.
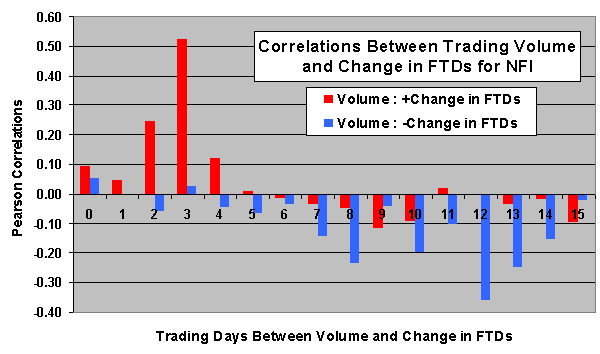
Hypothesis (3): Positive changes in FTDs and trading volume should move together (correlate positively), because it takes trading volume to create FTDs. The greater the positive change, the greater the volume generated. Negative changes in FTDs and trading volume should move oppositely (correlate negatively), because it takes trading volume to eliminate FTDs. The more negative the change, the greater the volume generated. There should be a lag between trading volume and positive changes in FTDs, because (by definition) a short sale does not fail until a specified number of business days have elapsed (three trading days for most traders and normally 13 trading days for market makers). If short sellers create FTDs in short bursts and clear them only slowly, there should be a lag between trading volume and negative changes in FTDs that is longer and less pronounced than the lag for positive changes in FTDs.
There are no entries for 10/10/05 and 11/11/05 in the data for NFI FTDs, even though stock trading data is available for those two days. The analyses that follow ignore those two days.
Testing Hypothesis (1):
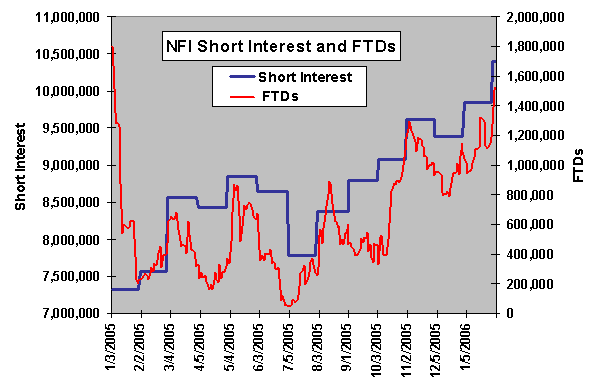
The following chart shows monthly NFI short interest and aggregate FTDs. Short interest is available only on a calendar month basis, hence the stair step plot. The Pearson correlation between these two series is .59, suggesting a fairly strong relationship and supporting Hypothesis (1) above. The large drop in FTDs at the beginning of 2005 coincides with the initial implementation of SEC Regulation SHO, which “requires short sellers in all equity securities to locate securities to borrow before selling, and also imposes additional delivery requirements on broker-dealers for securities in which a substantial number of failures to deliver have occurred.” After that time, FTDs account for about half of the changes in short interest. The chart shows clearly that FTDs have risen dramatically since mid-2005. Regulation SHO is not suppressing new fails.
Testing Hypothesis (2):
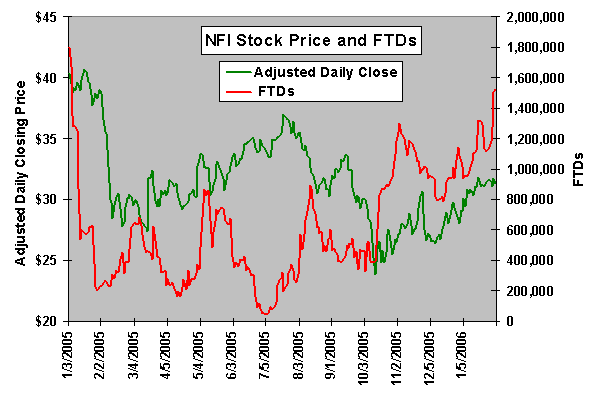
The next chart shows NFI stock price (daily close adjusted for dividends and splits) and aggregate FTDs. The Pearson correlation between these two series is -.26, suggesting a tendency to move in opposite directions as proposed in Hypothesis (2) above. In other words, when FTDs go up, there is a tendency for the stock price to go down. Starting the correlation analysis on 2/1/05 instead of 1/3/05 yields a much stronger negative correlation of -.49. This large difference in correlation via elimination of a relatively few data points suggests anomalous behavior at the beginning of 2005, as might be expected with the initial implementation of SEC Regulation SHO.
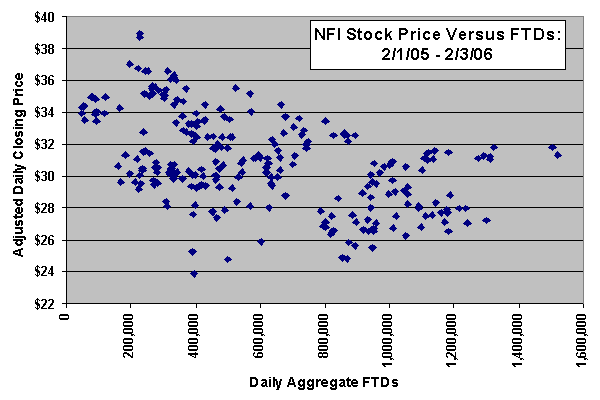
The following scatter plot offers another view of the stock price-FTDs relationship for the period 2/1/05-2/3/06, excluding the initial month of Regulation SHO implementation. It shows that a linear fit between stock price and FTDs is reasonable for the current regulatory environment. The best-fit slope for this data set indicates that the stock price declines a little over $4 for every 1,000,000 FTDs. (This relationship may hold for some amount of the total short interest, but a linear relationship may not hold as total short interest varies widely.)
Testing Hypothesis (3):
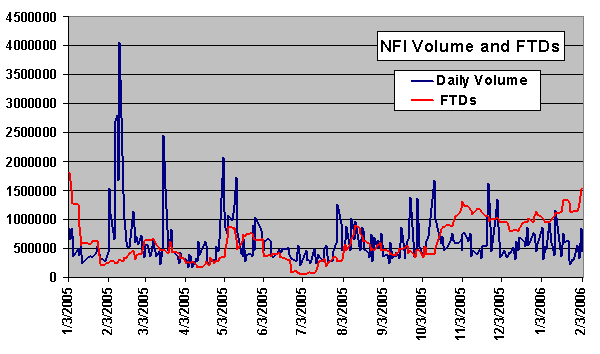
The next chart shows shows NFI daily trading volume and aggregate FTDs. During 1/4/05-2/3/06, creation and clearing of FTDs comprises on average about 8.5% of NFI trading volume. Hypothesis (3) above proposes a relationship between trading volume and the lagged change in FTDs, with the lag potentially different for increases in FTDs (short selling) and decreases in FTDs (short covering), so the next steps are:
1. Calculate the daily changes in aggregate FTDs;
2. Separate the daily changes into a set of increases and a set of decreases; and,
3. Compare with trading volume these two sets of changes, lagged to cover all potentially critical FTD creation intervals.
The next chart shows the results, with red bars depicting the correlations between trading volume and increases in FTDs (short selling) and blue bars showing the correlations between trading volume and decreases in FTDs (short covering). The chart shows that increases in FTDs correlate most strongly, and fairly convincingly, with volume three trading days in the past. Decreases in FTDs correlate most strongly, but less convincingly, with volume 7-14 trading days in the past. Correlations for lags in FTD changes of 16-33 days show no pronounced correlations or patterns. It seems that creation of FTDs does tend to occur in short bursts, and clean-up of FTDs is slower than creation. (As shown in the top chart above, there has in general been less clean-up of FTDs than creation for NFI since mid-2005.) These results support Hypothesis (3) above.
In summary, the trend in FTDs for NFI indicates substantial defiance of the intent of Regulation SHO, and this defiance is depressing the price of NFI stock. New FTDs most likely come from short sales three trading days in the past, implying that those most responsible for creating the FTDs are not market makers.
Conclusions are subject to uncertainties inherent in statistical inference from the limited information available from aggregated FTD data. Trade-by-trade data, were it available, would provide certainty. Results may be similar for other stocks consistently on the NASDAQ and the NYSE Regulation SHO threshold security lists.