After reviewing our update of the relationship between crude oil price and overall stock market behavior, a reader requested a similar analysis of the relationship between crude oil price and an energy sector Exchange-Traded Fund (ETF) such as Energy Select Sector S&P Depository Receipts (XLE). The reader’s hypothesis is that energy ETFs follow crude oil spot price fairly well. Comparing the weekly crude oil spot price for the U.S. with the weekly close for XLE for over the period 1/99-8/07, we find that:
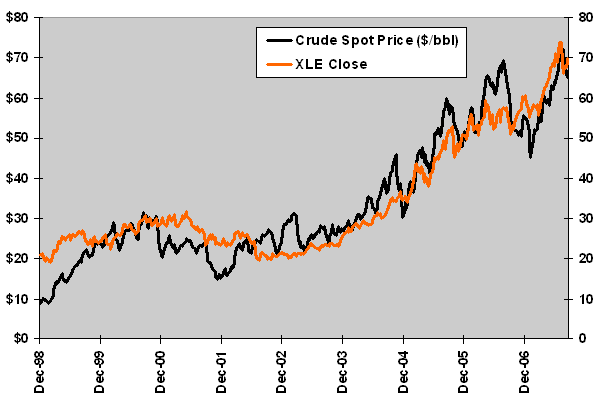
The following chart compares the weekly behavior of the crude oil spot price for the U.S. with the weekly close for XLE. The two series do track fairly well, with oil price somewhat more volatile than the ETF.
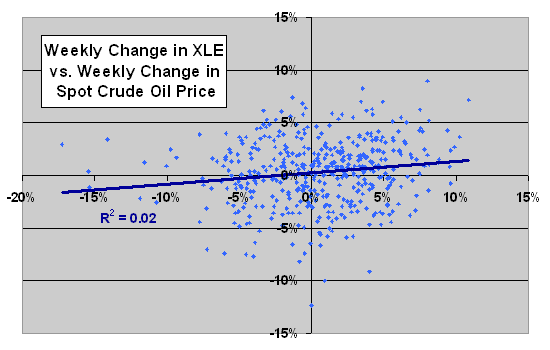
For more precise measurement of the relationship, we compare weekly changes in the two series.

The following scatter plot relates the weekly change in XLE to the weekly change in crude oil spot price for the U.S. Given the previous chart, the Pearson correlation is a surprisingly weak 0.15, and the R-squared statistic is only 0.02, suggesting that variations in weekly oil price explain only 2% of weekly movements in XLE. Therefore, on a short-term basis, other factors dominate in determining the value of XLE.
Might dramatic swings in crude oil prices predict XLE returns over longer periods?

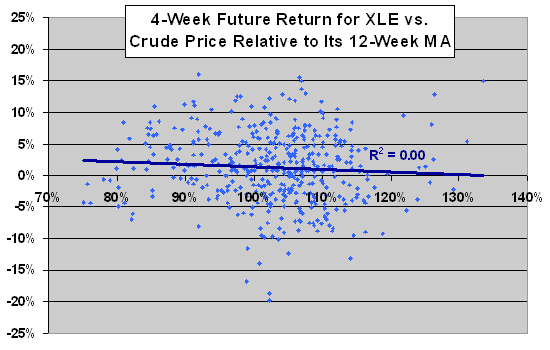
The next scatter plot relates the 4-week future return for XLE to U.S. crude oil spot price relative to its 12-week moving average (MA). When the latter measure is high (low), crude oil prices have recently risen (fallen). The chart suggests a very slight tendency for XLE to reverse the recent oil price trend. However, the Pearson correlation is just -0.07, and the R-squared statistic is practically zero, indicating no relationship.
The sample is not as large as implied by the number of data points because the return and moving average intervals are longer than the weekly sampling interval.
Does oil price lead XLE, or does XLE tend to anticipate oil price moves?

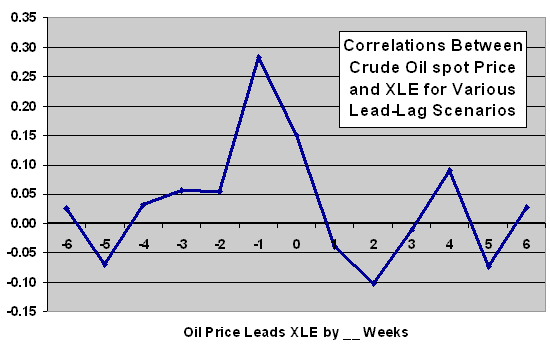
The final chart investigates whether crude oil price leads or lags the value of XLE by measuring the correlation between the weekly change in XLE and the weekly change in crude oil spot price for various scenarios, ranging from XLE leading oil price by six weeks (-6) to oil price leading XLE by six weeks (6). It shows a peak in correlation for the scenario that XLE leads oil price by one week, with correlations for other scenarios mostly noise.
The implication that XLE anticipates the next-week change in crude oil price probably derives from misalignment of weekly measurements rather than real XLE forecasting power for actual oil prices. According to the Energy Information Administration (EIA): “Weekly…prices are calculated by EIA from daily data by taking an unweighted average of the daily closing spot prices for a given product over the specified time period.” Since the weekly spot oil price is an average daily price rather than the closing price for the week, the oil price is somewhat stale compared to the XLE price, which is a weekly close.

In summary, although energy sector ETFs track the price of crude oil fairly well over long periods during 1999-2007, short-term variations in the two series are only slightly related.