A reader asked: “Could you review the TFS Market Neutral (TFSMX) mutual fund the same way you reviewed the Hussman Strategic Growth (HSGFX) mutual fund? TFSMX is a market neutral mutual fund from the same firm that runs a market neutral hedge fund available only to accredited investors.” Using weekly adjusted prices for TFSMX during 9/7/04 (the earliest available) through 10/23/09 (268 weeks), along with comparable data for HSGFX, the S&P 500 Index and S&P Depository Receipts (SPY), we conclude that:
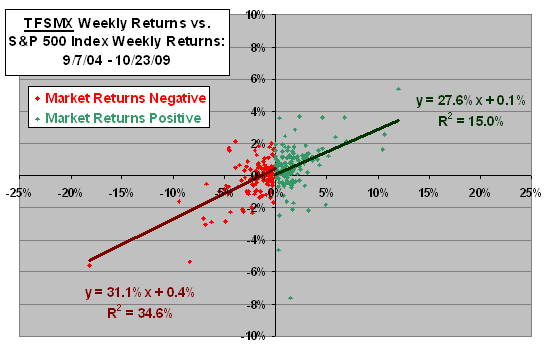
The following scatter plot relates the adjusted weekly returns of TFSMX to those of the S&P 500 Index separately when the weekly index return is negative (red) and positive (green) over the entire sample period. The chart shows both the equation for the best-fit line and the R-squared statistic for each of these two scatters. Results show that the TFSMX portfolio is a bit more sensitive to market fluctuations when the market declines (slope or beta of 31.1% and R-squared of 34.6%) than when it advances (slope or beta of 27.6% and R-squared of 15.0%).
Note that the y-intercept or alpha is positive both when the broad market declines and when it advances, but more so when the market declines. This result indicates operationally defensive stock holdings.
For comparison, we examine HSGFX over the same period.

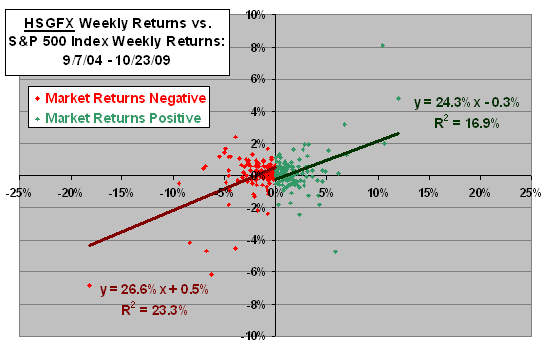
The next scatter plot relates the adjusted weekly returns of HSGFX to those of the S&P 500 Index separately when the weekly index return is negative (red) and positive (green) over the same sample period. HSGFX is arguably more market neutral than TFSMX during this period. HSGFX exhibits a positive (negative) alpha when the broad stock market declines (advances).
For another perspective, we look at average weekly returns.

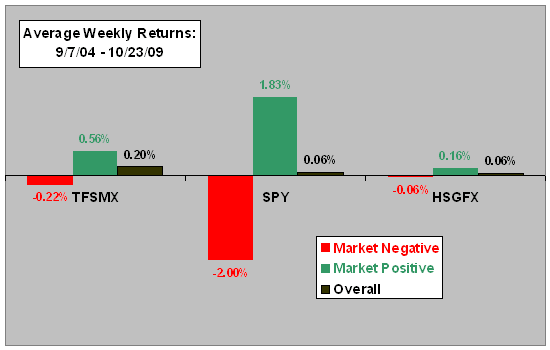
The final chart compares average weekly adjusted returns for TFSMX, SPY and HSGFX when the weekly S&P 500 Index return is negative (red), positive (green) and overall (black) for the entire sample period. Both TFSMX and HSGFX greatly dampen market swings, the latter more so.
The standard deviations of weekly returns are 1.4%, 2.9% and 1.2%, respectively, for TFSMX, SPY and HSGFX over the sample period. Metrics that adjust returns for volatility (e.g., Sharpe ratio) therefore substantially favor TFSMX and HSGFX over SPY.

In summary, evidence from simple tests on weekly data over a limited sample period indicate that the TFS Market Neutral (TFSMX) mutual fund has (1) dampened but not neutralized broad market volatility and (2) generated some alpha.