Does the Thanksgiving holiday, a time of families celebrating plenty, give U.S. stock investors a sense of optimism that translates into stock returns? To investigate, we analyze the historical behavior of the S&P 500 Index during the three trading days before and the three trading days after the holiday. Using daily closing levels of the S&P 500 Index for 1950-2022 (73 events), we find that:
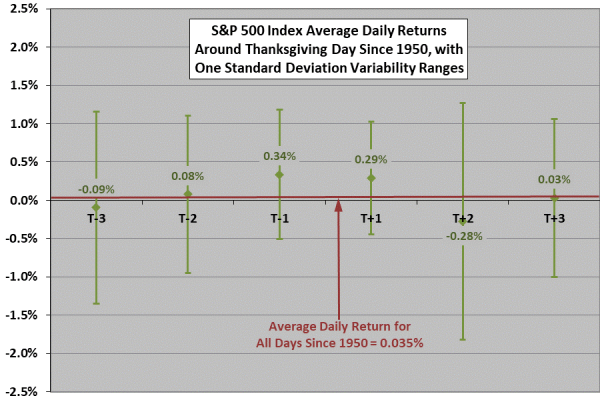
The following chart shows average daily S&P 500 Index returns for the three trading days before (T-3 to T-1) and the three trading days after (T+1 to T+3) Thanksgiving over the full sample period, with one standard deviation variability ranges. The average daily return for all trading days in the sample is 0.035%. Results suggest:
- Strength and low volatility during the trading days just before and just after Thanksgiving.
- Weakness and high volatility the second trading day after Thanksgiving.
As usual for daily data, noise generally dominates signal.
To check the reliability of these tendencies, we look at two subsamples.
The next chart compares the average daily returns for the three trading days before and after Thanksgiving for two subsamples: 1950-1989 (40 events), and 1990-2022 (33 events). This chart has no variability ranges and uses a finer vertical scale than the preceding one. The days just before and just after Thanksgiving are positive in both subsamples, but markedly less so in recent data, and the next day is negative in both.
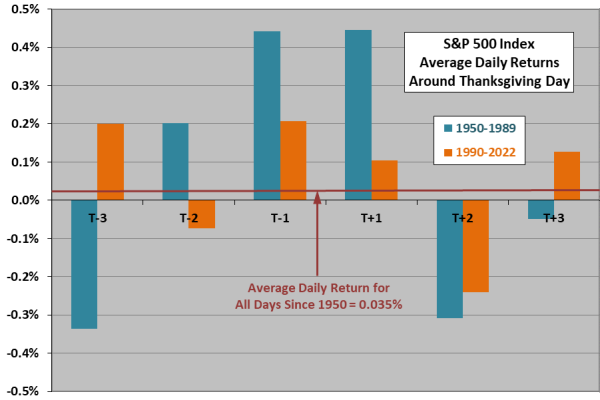
In summary, best guess is that any anomalous U.S. stock market strength around Thanksgiving comes one trading day before and one trading day after the holiday, with the next day weak, but effects may be weakening and noise generally dominates.
Cautions regarding the finding include:
- As noted, any return anomaly is small compared to return variability, so experience by year varies widely.
- To the extent that the distribution of daily S&P 500 Index returns is wild, interpretation of the average return and standard deviation of returns breaks down.