Do simple momentum trading strategies applied to major U.S. stock market sectors outperform reasonable benchmarks? To investigate, we apply three simple momentum strategies to the nine sector exchange-traded funds (ETF) defined by the Select Sector Standard & Poor’s Depository Receipts (SPDR):
Materials Select Sector SPDR (XLB)
Energy Select Sector SPDR (XLE)
Financial Select Sector SPDR (XLF)
Industrial Select Sector SPDR (XLI)
Technology Select Sector SPDR (XLK)
Consumer Staples Select Sector SPDR (XLP)
Utilities Select Sector SPDR (XLU)
Health Care Select Sector SPDR (XLV)
Consumer Discretionary Select SPDR (XLY)
The three strategies are: (1) allocate all funds at the end of each month to the sector ETF with the highest total return over the past six months (6-1); (2) allocate all funds at the end of each month to the sector ETF with the highest total return over the six months ending the prior month (6-1;1), hypothesizing that the skip-month avoids short-term reversals; and, (3) more cautiously, allocate all funds at the end of each month either to the sector ETF with the highest total return over the past six months or to cash depending on whether the S&P 500 Index is above or below its 10-month simple moving average (6-1;SMA10). A six-month ranking period is intuitively large enough to gauge sector momentum but small enough to react to changes in business conditions that might favor one sector over others. Using monthly dividend-adjusted closing prices for the sector ETFs, the S&P 500 index, 3-month Treasury bills (T-bills) and S&P Depository Receipts (SPY) over the period December 1998 through December 2015 (205 months), we find that:
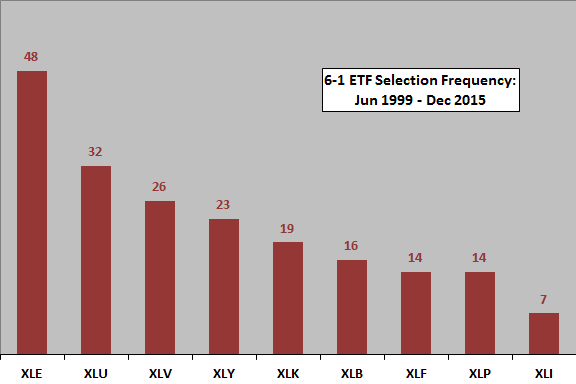
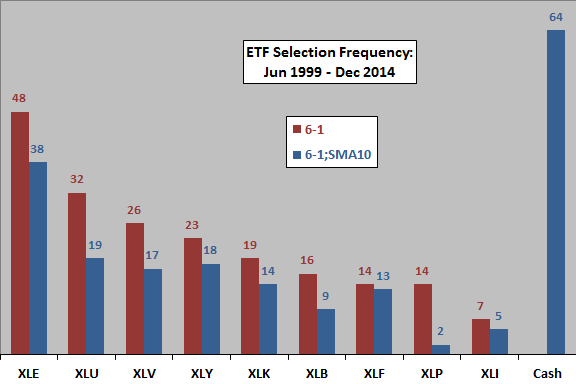
The following chart shows the distribution of sector ETF winners based on past six-month total return over the entire sample period. The energy sector comprises 48 of the 199 monthly winners (24%).
How does applying the above 6-1 and 6-1;1 strategies translate into cumulative returns?
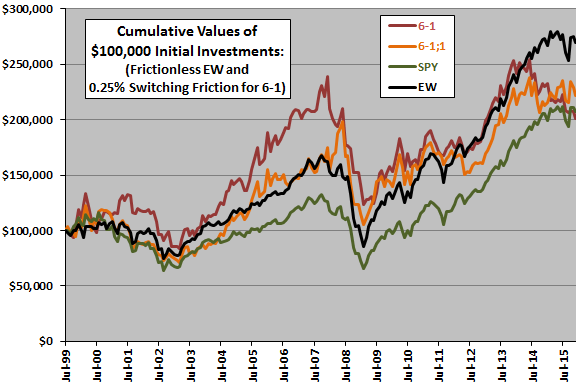
The next chart compares the cumulative values of $100,000 initial investments in the 6-1 and 6-1;1 strategies, SPY and an equally weighted portfolio of the sector ETFs (EW), rebalanced monthly, over the available sample period. Calculations derive from the following assumptions:
- Reallocate/rebalance at the close on the last trading day of each month (assume that values and total six-month past returns for the ETFs can be calculated just before the close).
- Trading (switching) friction for the 6-1 and 6-1;1 strategies is 0.25% of the balance whenever there is a change in holdings, but EW portfolio rebalancing is frictionless for conservative benchmarking.
- Ignore any tax implications of trading.
At the assumed level of switching friction, the 6-1 strategy mostly outperforms SPY and sometimes outperforms the EW portfolio (sometimes adds value to simple diversification). However, the 6-1 strategy recently underperforms EW and has a lower terminal value than both EW and SPY. The attractiveness of the 6-1 strategy depends mostly on the 2003-2007 subperiod.
The 6-1;1 strategy mostly trails the 6-1 strategy until the end of the sample period.
Compound annual growth rates are about 4.4%, 5.0%, 4.6% and 6.2% for 6-1, 6-1;1, SPY and EW, respectively.
How do average monthly returns, as alternative measures of strategy performance, compare?
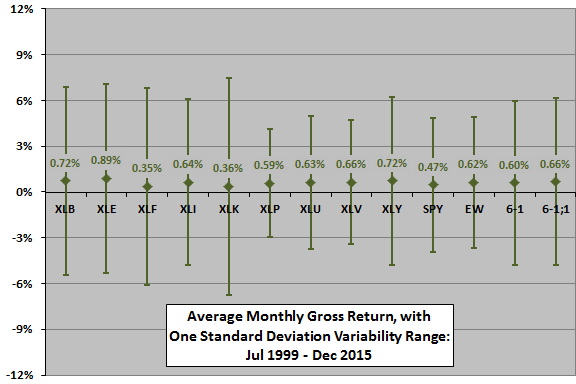
The next chart summarizes gross average (arithmetic mean) monthly returns and standard deviations of monthly returns for each of the sector ETFs, SPY, the EW portfolio and the 6-1 and 6-1;1 strategies over the available sample period. The 6-1 strategy underperforms the EW portfolio, with lower average return and considerably higher volatility. Monthly gross reward-to-risk ratios (rough Sharpe ratios) for 6-1, 6-1;1 and EW are 0.14, 0.11 and 0.12, respectively.
What is the long-term trend in performance of the 6-1 strategy relative to the EW portfolio?
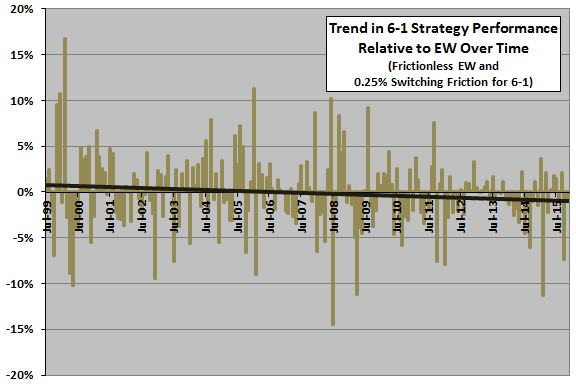
The next chart shows the net monthly return for the 6-1 strategy minus same-month EW portfolio return over the available sample period, along with a best-fit trend line. The trend line slopes downward into negative values, suggesting that the 6-1 strategy adds value to simple diversification early in the sample period but is a drag later. However, the sample period is not long and monthly relative returns highly variable.
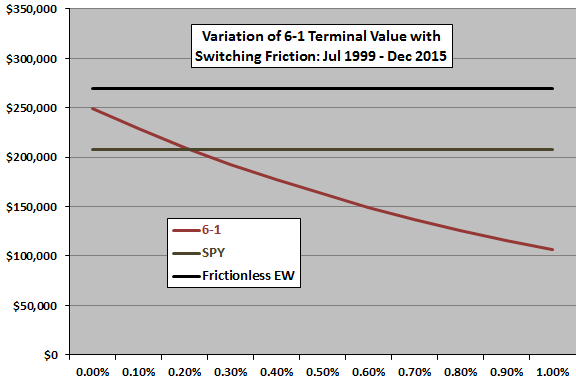
How does the terminal value of the 6-1 strategy vary with assumed level of switching friction?
The next chart plots the terminal value of the 6-1 strategy for switching frictions ranging from 0.00% to 1.00%, along with the fixed terminal values of buying and holding SPY and holding the frictionless EW portfolio. Results indicate that the 6-1 strategy beats SPY at low but achievable levels of switching friction but never beats the EW portfolio benchmark.
How does the alternative 6-1;SMA10 strategy compare?
The next chart compares the distributions of sector ETF winners/Cash for the 6-1 and 6-1;SMA10 strategies. The latter is in Cash for 64 of the 199 monthly winners (32%). Defensive sectors tend to become less relevant for the 6-1;SMA-10 strategy than for the 6-1 strategy.
How does applying the 6-1;SMA10 strategy translate into cumulative returns?
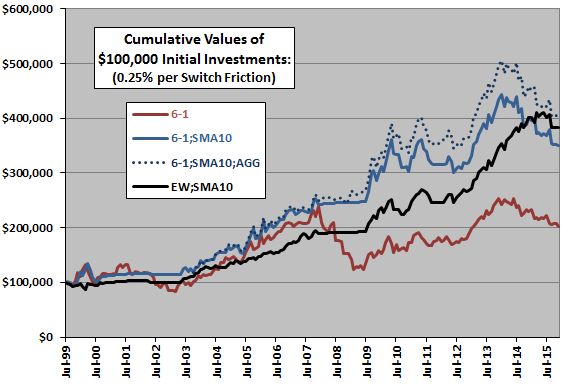
The final chart compares the cumulative values of $100,000 initial investments in the 6-1 strategy, the 6-1;SMA10 strategy and a benchmark EW:SMA10 strategy that holds the EW portfolio (goes to cash) when the S&P 500 Index is above (below) its 10-month simple moving average. An auxiliary test requested by a subscriber substitutes iShares Core US Aggregate Bond (AGG) for T-bills when in “cash” since its initial availability in October 2003 (6-1;SMA10;AGG). As above, calculations derive from the following assumptions:
- Reallocate/rebalance at the close on the last trading day of each month (assume that values and total six-month past returns for the ETFs, and the S&P 500 Index 10-month simple moving average, can be calculated just before the close).
- Switching friction for the 6-1 and 6-1;SMA10 strategies is 0.25% of the balance whenever there is a change in holdings, but EW portfolio rebalancing is frictionless for conservative benchmarking.
- Ignore any tax implications of trading.
The 6-1;SMA10 strategy generally outperforms the 6-1 strategy based on avoidance of most of major downturns. It also mostly provides an edge over EW;SMA10, suggesting that sector ETF momentum mostly adds value to simple diversification during bull markets. However, this value disappears at the end of the sample period. Using AGG rather than T-bills as “cash” provides some boost. However, this boost may derive from AGG capital gain during a sample period with mostly falling interest rates.
The average monthly gross return for the 6-1;SMA10 (6-1) strategy is 0.79% (0.60%), with standard deviation of monthly returns 4.14% (5.37%) and and rough monthly Sharpe ratio 0.19 (0.11). Comparable statistics for EW;SMA10 are 0.70%, 2.57% and 0.27.
Compound annual growth rates are about 4.4%, 7.7% and 8.5% for 6-1, 6-1;SMA10 and EW;SMA10, respectively.
In summary, evidence from a limited sample period suggests that a simple sector ETF momentum strategy does not add value to an equally weighted benchmark due to increasingly weak relative performance.
For robustness tests and consideration of additional strategy variations, see “Simple Sector ETF Momentum Strategy Robustness/Sensitivity Tests”, “Alternative Sector ETF Momentum Metrics” and “Hedges/Shorting to Exploit Sector ETF Momentum?”.
Cautions regarding findings include:
- Sample size is modest (just 34 independent six-month momentum ranking intervals and about 20 independent 10-month SMA intervals).
- The selected ETF ranking interval derives from prior academic studies that most often use six-month and 12-month ranking intervals, with one-month holding intervals. This prior research may impound (and therefore transmit) data snooping bias, which is especially pernicious for small samples. Ranking intervals other than six months and holding periods other than one month may produce different results. For the above tests, using longer ranking and holding intervals would effectively reduce the already-small sample size. Optimizing the ranking and holding intervals would elevate data snooping bias.
- As noted, the boost in performance from the 6-1;SMA10;AGG strategy may derive from falling interest rates over much of the available sample period. This outperformance may not persist when interest rates rise.