Do the poor returns and high volatility of the “buy-and-hold-is-dead” U.S. stock market since the beginning of 2000 represent a tailwind for market timers? In other words, is buy-and-hold effective as a benchmark for distinguishing between market timer luck and skill in recent years? To check, we measure the performances of various simple monthly market timing approaches (equal weighting with cash, 10-month simple moving average signals, momentum, and coin-flipping) during the 2000s. Using monthly closes for the dividend-adjusted S&P 500 Depository Receipts (SPY), the 3-month Treasury bill (T-bill) yield and the S&P 500 Index from December 1999 through October 2011 (earlier for S&P 500 Index signal calculations), we find that:
The following table summarizes S&P 500 Index monthly return statistics for January 1950 through December 1999 and January 2000 through October 2011. The arithmetic mean monthly return is much lower, and the standard deviation of monthly returns higher, since the beginning of 2000 than during the prior half-century. The percentage of months with positive returns is lower.

Consider a fly-off of the following simple long-only strategies during the 2000s:
- Buy and Hold: Buy and hold SPY (as a benchmark).
- EW SPY-Cash: Hold equal amounts of SPY and cash, rebalancing monthly.
- 10-Month SMA: Hold SPY (cash) when the monthly close of the S&P 500 Index is above (below) its 10-month simple moving average (SMA).
- 6-1 Intrinsic Momentum: Hold SPY (cash) when the past 6-month return for the S&P 500 Index is positive (negative).
- 6-1-1 Intrinsic Momentum: Hold SPY (cash) when the past 6-month return, with a skip-month, for the S&P 500 Index is positive (negative).
- 100 Monthly Coin Flippers: Hold SPY (cash) when the coin comes up heads (tails). Note that, after a large number of trials, the average performance of coin flippers will approximately match EW-SPY-Cash.
For this fly-off, we make the following assumptions:
- The return on cash is the 3-month T-bill yield (divided by 12).
- There are no trading frictions (biased in favor of all timing strategies). The effect of actual trading frictions depend on strategy trading frequency, bid-ask spread, specific broker fees and account size.
- For the 10-Month SMA and 6-1 Momentum strategies, signals derive from data just before monthly closes, allowing executions at monthly closes.
- Ignore tax implications of trading.
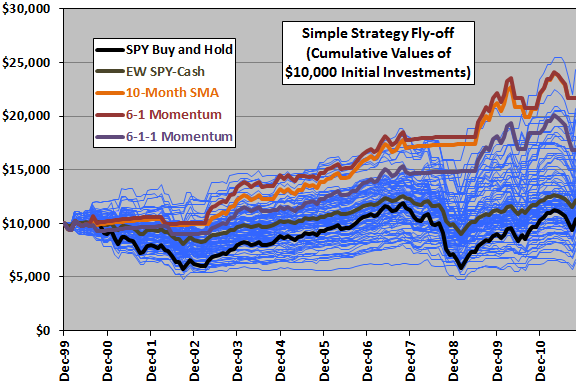
The following chart compares the gross cumulative performances of the above strategies during January 2000 through October 2011, tracking the 100 coin flippers with thin blue lines and the other strategies with thick lines. Some notable findings, based on gross terminal values, are:
- 72% of Monthly Coin Flippers beat Buy and Hold, and the average Monthly Coin Flipper beat the market by 19%. In other words, the sample period presents a tailwind for long-only market timers.
- The best (worst) Monthly Coin Flipper outperformed (underperformed) Buy and Hold by 133% (-39%).
- The 10-Month SMA and 6-1 Momentum strategies perform very similarly and beat all but one of the 100 Monthly Coin Flippers. Either these two strategies add value, or they are very lucky within this sample.
As expected, because it is half out of the market, the EW SPY-Cash strategy generates a gross cumulative return evolution very similar to that of the average Monthly Coin Flipper (not shown).
Imposing trading frictions would depress results for all timing strategies (by differing amounts according to trading frequency).
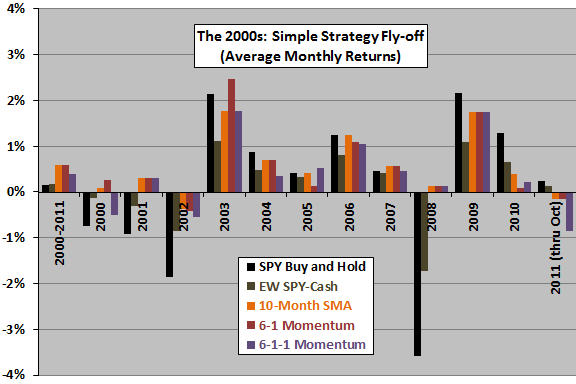
For a different view, we look at average monthly returns.

The next chart compares the average (arithmetic mean) gross monthly returns for the above strategies during January 2000 through October 2011 and during each year over this period. As noted above, the average performance of the Monthly Coin Flippers is similar to that for EW SPY-Cash.
The EW SPY-Cash, 10-Month SMA, 6-1 Momentum and 6-1-1 Momentum strategies have similarly low standard deviations of monthly returns compared to Buy and Hold. Standard deviations of monthly returns for the Monthly Coin Flippers are lower than those for Buy and Hold but higher than the low-volatility strategies.

In summary, long-only timers of the U.S. stock market who did not beat the market during 2000-2011 have some explaining to do. Even those timers whose signals add no value were likely to beat the market at a gross level.
Cautions regarding findings include:
- As noted, reported returns are gross. Including reasonable trading frictions would reduce returns for all the strategies that involve trading/rebalancing and could change their relative performance for some investors.
- 100 trials is not a lot for this type of test. Repeating with 100 new trials may generate noticeably different statistics for the Monthly Coin Flippers.
- 12 years is a short sample period for testing signals with signal measurement intervals of six and ten months.
- Performance of signal-based strategies may be sensitive to the assumption of coincident month-end measurement and execution.