A reader commented and asked:
“The article ‘Volatility is a Bear Market Signal’ by David Schwartz measures volatility not in terms simply of big percentage days, but a cluster of such days within a specified time period (movements in excess of 1% on FTSE on at least 20 of 40 consecutive trading days). The prediction made in 2007 looks to have been well founded, giving the strategy an apparent success rate of 8 out of 9 hits if the author’s data can be trusted. What do you think?”
To check this signal independently, we measure returns at intervals of 5, 10, 21, 63, 126 and 252 trading days after onset of concentrations of days with close-to-close volatility greater than 1% for the S&P 500 Index. Using daily closes of the index for January 1950 through May 2010, we find that:
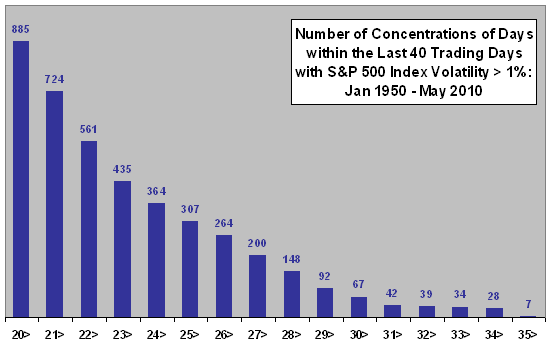
The following chart shows the number of trading days with lagged concentrations of S&P 500 Index daily volatility over the entire sample period. For example, there are 885 instances of intervals of 40 trading days during which at least 20 days have S&P 500 Index movement (up or down) of at least 1%. However, these intervals cluster/overlap, such that a trader tracking this condition and exiting the market upon encountering it would not be able to act on most of the 885 signals.
There are no intervals of 40 trading days with 36 high-volatility days.
What are the future returns after tradable signals?

Assumptions for measuring tradable future returns are:
- Exit is at the close with a signal (the trader must slightly anticipate the daily close that reaches the threshold condition).
- For future return intervals of 63 trading days or less, signals must be at least three months apart (frequent traders could relax this assumption for short-term trading).
- For future return intervals of 126 (252) trading days, signals must be at least six months (one year) apart.
- Ignore trading frictions (there are not many trades) and dividends.
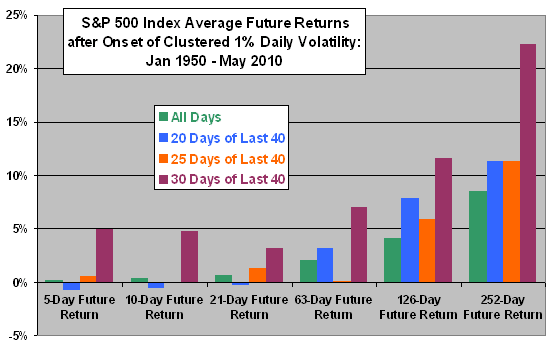
The next chart summarizes S&P 500 Index average future returns at various horizons after onset of clustered daily volatilities of at least 1% (winnowed as described) for cluster thresholds of 20, 25 and 30 trading days out of 40 over the entire sample period. Sample sizes are small, with no more than 28, 10 and 4 trades over 60+ years for thresholds of 20, 25 and 30 trading days out of 40, respectively.
Average future returns for all days in the sample provide a benchmark for abnormal behavior.
Results do not confirm a belief that tradable volatility clusters reliably signal poor future returns.

More generally, arguments and charts such as presented in the cited article often explicitly or implicitly assume perfect foresight with regard to exit signal threshold and signal economic value. A real investor has access only to past data and may infer different (or no) thresholds based on these data. Said differently, seeing “patterns” retrospectively is not the same as setting rules that make money in real time. Even if a investor knew what threshold to use in the past, the loss avoidance implied in the article unrealistically assumes getting back into the market at bear market lows.
Also, the number of volatility rule/count/threshold combinations the author tried before settling on >20 out of the last 40 over 1% is unknown. The more combinations considered, the more likely the chosen one impounds data snooping bias (luck). The smaller the sample is, the stronger the bias.
In summary, evidence from simple tests does not support a belief that clusters of daily volatility reliably signal poor future returns.