Is there information useful to investors in the “yield curves” of commodity futures? In their December 2009 paper entitled “Structural Properties of Commodity Futures Term Structures and Their Implications for Basic Trading Strategies”, Rolf Duerr and Matthias Voegeli investigate the informativeness of price progressions across commodity futures contracts with different maturities (term structures or yield curves) over rolling 12-month windows. Specifically, they focus on trading commodity futures contracts based on the current slopes of these curves and on the stabilities of the shapes of the curves over time (slope and curvature). Using weekly closing settlement prices for 23 energy, metals, agriculture and livestock commodities spanning January 1998 through July 2009, they find that:
- Over the entire sample period, term structures are on average:
- Upward sloping ( in contango) for aluminum, gold, silver, wheat, Kansas wheat, corn, cotton, coffee and cocoa).
- Downward sloping (in backwardation) for copper, lead, nickel, zinc and soybeans.
- Flat for energy, sugar and livestock.
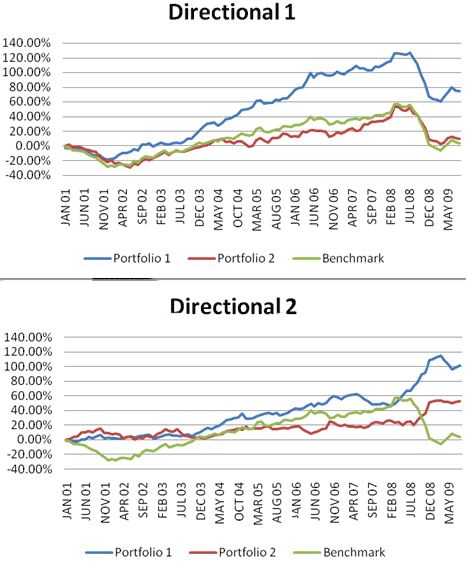
- Investment strategies which exploit the following three aspects of information about individual commodity roll yields consistently outperform a long-only benchmark during January 2001 through July 2009 (see the charts below):
- Contango versus backwardation.
- Current variation in yield curve steepness with duration.
- Yield curve stability over the prior three years (persistent slope and curvature).
The following charts, taken from the paper, summarize cumulative gross returns for commodity roll return strategies based on the above three aspects of information from commodity yield curves. To test the value of information about contango versus backwardation and current yield curve slope variation:
- The Directional 1 (long-only) strategy buys the contracts of commodities in contango (backwardation) for which slopes on the respective current yield curves are smallest (largest) in magnitude.
- The Directional 2 (long-short) strategy sells (buys) the contracts of commodities in contango (backwardation) for which the slopes on the respective current yield curves are largest in magnitude.
- The benchmark strategy buys and holds the front contracts for all 23 commodities until expiration, iteratively rolling to the next contract.
To test the value of information about lagged stability of commodity yield curves:
- Portfolio 1 weights equally the 12 commodities with the most stable yield curves over the prior three years, reformed every three years.
- Portfolio 2 weights equally the 11 commodities with the least stable yield curves over the prior three years, reformed every three years.
Results indicate that both the Directional 1 and 2 strategies, when implemented via Portfolio 1 (2), consistently outperform (do not consistently outperform) the benchmark, suggesting that commodity yield curve lagged stability is informative.
Results ignore transaction costs since the Directional 1 and 2 strategies have the same number of roll dates per contract as the benchmark and therefore comparable transaction costs.

In summary, commodity traders may be able to enhance roll returns by focusing on those commodities for which term structures (yield curves) exhibit stability over recent years.