Reader Mike Korell of ChartsEdge suggested an evaluation of his own S&P 500 Index forecasts for inclusion in Gurus. These “stock market forecasts are based on cycle data which has been analyzed by a Pattern Recognition Program. This use of artificial intelligence reduces the effect of personal bias and allows the simultaneous cycle analysis of many input variables.” To construct a statistical evaluation, we focus on the open and close levels of the ChartsEdge weekly forecasts, apparently issued on Sundays. Using estimates of the forecasted S&P 500 Index open and close levels from inspection of the ChartsEdge weekly charts and actual contemporaneous S&P 500 Index weekly open and close data for weeks beginning 9/8/08 through 9/7/10 (104 weekly returns), we find that:
Over the entire sample period, the average weekly ChartsEdge forecasted (actual) S&P 500 Index return is +0.05% (-0.04%), with standard deviation of weekly returns 2.80% (4.15%), so forecasted weekly returns tend to be higher and less volatile than actual weekly returns.
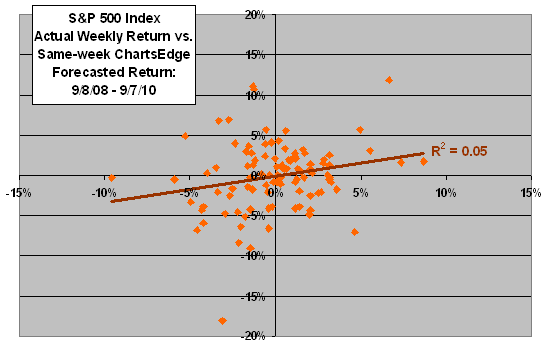
The following scatter plot relates actual weekly S&P 500 Index returnto the same-week forecasted returns over the entire sample period. The Pearson correlation between the two series is 0.22 and the R-squared statistic is 0.05, indicating that forecasted returns explain 5% (one twentieth) of actual weekly returns.
Removing the two observations corresponding to the single largest weekly loss (-18.1% the week of 10/6/08) and the single largest weekly gain (+11.9% the week of 11/24/08) of the index reduces the explanatory power of the forecasts from 5% to 2%. In other words, just a few additional realistically extreme observations could substantially change predictive power statistics.
Observations in the upper right and lower left quadrants represent forecasts in the correct direction (59% of all observations). However, a few of the correct and incorrect directional forecasts correspond to immaterially small actual returns (comparable to reasonable trading frictions).
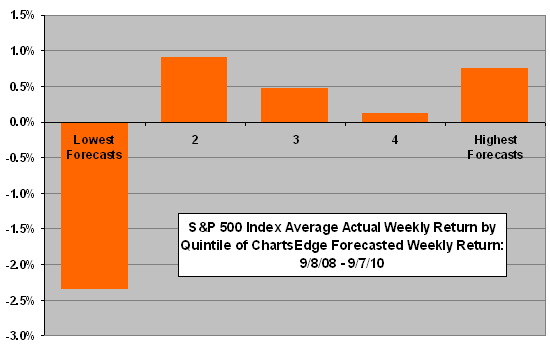
To investigate non-linearity in the relationship, we consider average actual returns by forecast quintile.

The next chart shows the average return by quintile (fifth) of forecasted weekly returns, sorted from lowest to highest, over the entire sample period. Results are not systematic across quintiles and suggest that the above predictive power of the forecasts derives mostly from the lowest (most negative) forecasts. In fact, removing the 22 lowest forecasts (roughly the lowest quintile) reduces the R-squared statistic for the relationship to 0.00. In other words, only forecasts of substantially negative returns appear to exhibit predictive power.
The success of a trading strategy based on the ChartsEdge weekly forecasted open and close therefore may depend critically on the frequency of large weekly declines in the sample period.
The sample is small for this kind of analysis (only 20-21 observations per quintile).

Note that the historical charts were not public until 9/12/10 (as a condition of evaluation). CXOadvisory.com reviews only publicly available forecasts/trading records to: (1) avoid risks of exposing proprietary data; (2) allow subscribers of reviewed services to verify that records are as issued; and, (3) allow CXOadvisory.com readers to check data and calculations. Note also that the forecast for the week beginning 1/11/10 is missing.
In summary, results from simple tests suggest that the ChartsEdge forecasts of weekly returns (open to close) may have some power to forecast bad weeks for the S&P 500 Index.
Using higher frequency data from the prediction charts (daily or intraday) may produce different results. Typically, higher frequency predictions are less accurate than lower frequency predictions because the noise to signal ratio in financial market returns increases as measurement interval decreases. Note that testing multiple intervals on the same set of data introduces data snooping bias.
Because this statistical, highly quantitative evaluation is markedly different in approach from the more qualitative assessments summarized in Gurus, it is not included in that summary.