What kind of economic environment makes a stock market boom? What changes in that environment lead to bust? In their September 2006 paper entitled “When Do Stock Market Booms Occur? The Macroeconomic and Policy Environments of 20th Century Booms”, Michael Bordo and David Wheelock examine the economic and policy conditions that supported equity market booms in ten developed countries (Australia, Canada, France, Germany, Italy, Japan, Netherlands, Sweden, the United Kingdom and the United States) during the 20th century. Using monthly inflation-adjusted stock prices from these countries, they conclude that:
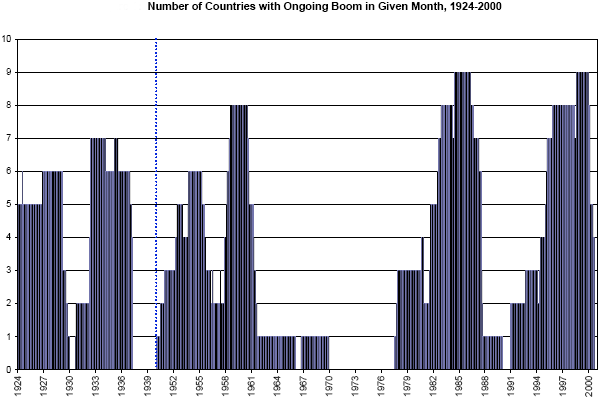
- Stock market booms are roughly in synch across countries during the 20th century. (See the first figure below.)
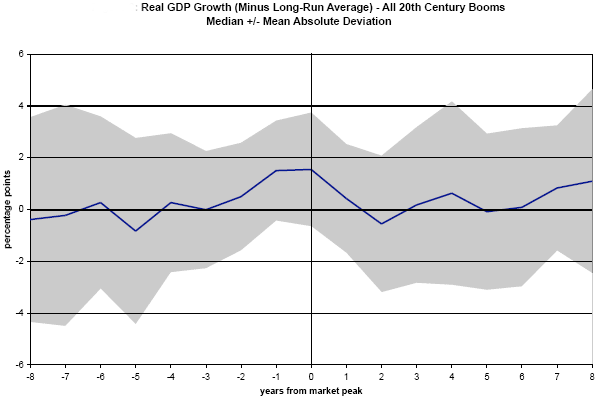
- Stock market booms tend to occur during cyclical recoveries and other periods of rapid real economic growth. (See the second figure below.)
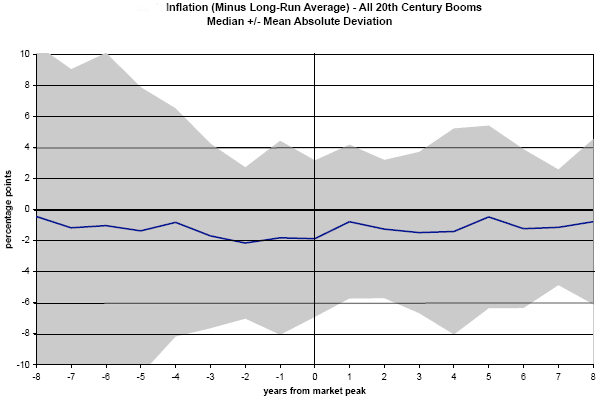
- Stock market booms typically start when inflation is low and declining and end fairly abruptly (within a few months) after an increase in the rate of inflation. Rising inflation tends to elicit tighter monetary conditions, as reflected by higher real interest rates, declining term spreads and slowing money supply growth. (See the third figure below.)
- Some stock market booms are associated not with rapid economic growth or low inflation, but with other factors such as changes in regulation, oil price shocks and political upheaval.
- Large declines in real stock prices (or outright market crashes) and slowing economic activity often follow stock market booms.
The following chart, taken from the paper, tracks the number of countries with a booming stock market across the 20th century. It shows that stock market booms are typically international phenomena involving the economies of several developed countries.

The next chart, also from the paper, shows the median real GDP growth rate (relative to its long-run average) from eight years before to eight year after stock market peaks (year 0). It shows that real GDP growth tends to increase sharply relative to its long-run average during the two years prior to a stock market peak, exceeding its long-run average by about 1.5%. Real growth tends to fall sharply during the two years after a stock market peak. The shaded area shows that the dispersion of real GDP growth rate observations declines around a stock market peak year.

The final chart, also from the paper, shows the median inflation rate (relative to its long-run average) from eight years before to eight year after stock market peaks (year 0). It shows that stock market booms tend to arise when inflation is below its long-run average and also falling. The median inflation rate is about 1% below its long-run average between four and seven years before a market peak, and 2% below its long-run average during the two years before a market peak. Inflation tends to return slowly to its long-run average after a market peak. The shaded area shows that the dispersion of inflation observations declines as the stock market approaches a peak year.

In summary, stock market booms arise from the confluence of strong economic growth and low inflation. Excessive (?) monetary policy reaction to rising inflation kills the booms.