A reader suggested looking at Rydex asset ratios as stock market sentiment indicators. The reasoning for these indicators is that a high (low) ratio of assets in bullish funds to assets in bearish funds indicates an overbought (oversold) market. Are these indicators useful? The most timing-intensive traders arguably use leveraged funds, suggesting that a bull-bear asset ratio for such funds may be especially informative and timely. We therefore use the ratio of daily closing asset level for the S&P 500 2x Strategy – H Class (RYTNX) mutual fund to daily closing asset level of the Inverse S&P 500 2x Strategy – H Class (RYTPX) mutual fund (Rydex 2X/-2X). Using daily asset levels for these funds from inception on 5/19/00 through January 2015, along with contemporaneous daily opens of the S&P 500 index (since fund assets are available only after the close), we find that:
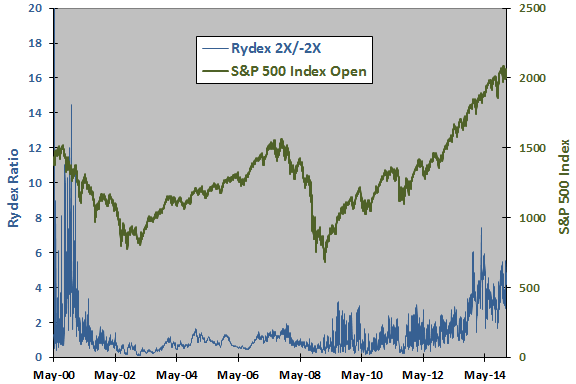
The following chart tracks the behaviors of Rydex 2X/-2X and the S&P 500 Index over the available sample period. The average value of Rydex 2X/-2X is 1.30, but visual inspection shows that this ratio is at times very volatile and may not have a stable average over time. Its relationship with the S&P 500 Index is not clear.
To explore the relationship, we examine lead-lag correlations between Rydex 2X/-2X and S&P 500 Index returns.
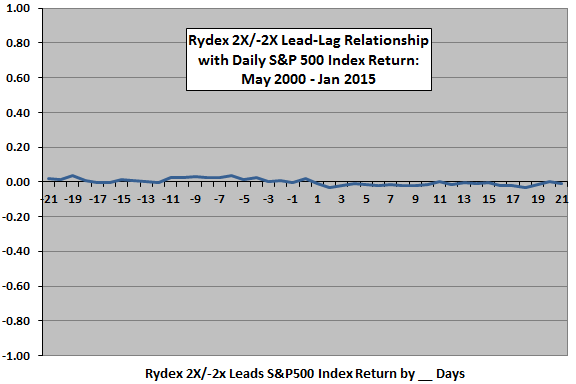
The next chart summarizes correlations between daily values of Rydex 2X/-2X and daily S&P 500 Index returns for lead-lag relationships ranging from stock market return leads Rydex 2X/-2X by 21 trading days (-21) to Rydex 2X/-2X leads stock market return by 21 trading days (21).
All correlations are very small, but are consistently negative between Rydex 2X/-2X and stock market returns over the next 10 trading days. We therefore look next at the relationship between Rydex 2X/-2X and cumulative stock market return over the next 10 trading days.
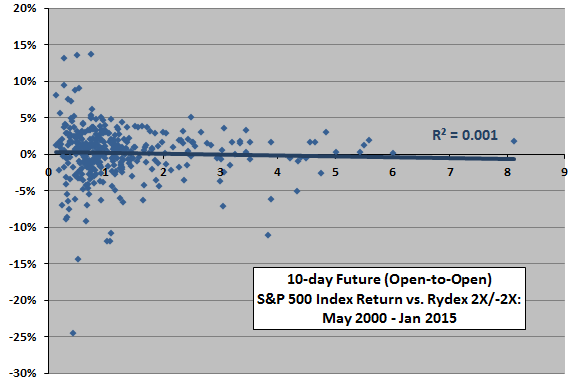
The following scatter plot relates the 10-day future return for the S&P 500 Index to Rydex 2X/-2X using a winnowed sample of independent 10-day intervals (from the next open to the open 10 trading days later). The Pearson correlation for these two series is -0.03 and the R-squared statistic 0.001, indicating that variation in Rydex 2X/-2X explains hardly any of the variation in S&P 500 Index cumulative return over the next two weeks. In other words, there is no linear relationship.
In case the relationship is materially non-linear, we look at rankings.
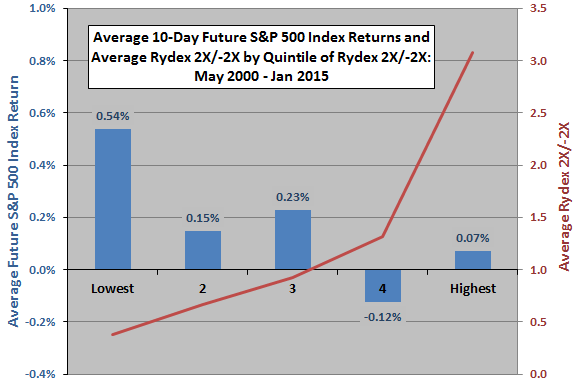
The next chart summarizes average 10-day future S&P 500 Index returns and average Rydex 2X/-2X by ranked fifth (quintile) of Rydex 2X/-2X values over the available sample period (again using the winnowed sample). Results suggest short-term long trades when Rydex 2X/-2X is very low; however, returns in the lowest quintile are very volatile.
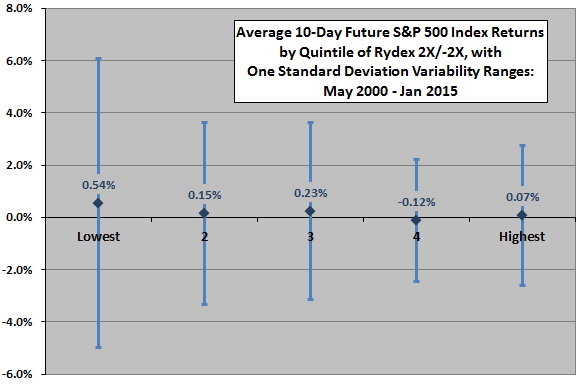
To illustrate the volatility, we recast the chart with variability ranges.
The next chart recasts average 10-day future S&P 500 Index returns by quintile of Rydex 2X/-2X values to include one standard deviation variability ranges. Returns of the lowest quintile are very volatile, and trading of low Rydex 2X/-2X signals therefore very risky.
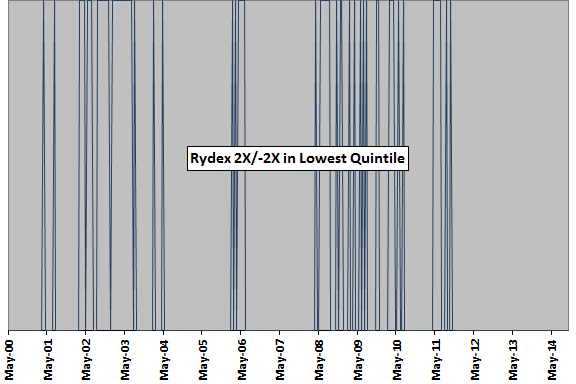
When is Rydex 2X/-2X very low?
The vertical lines in the next chart show when the observations in the lowest quintile of the preceding two charts occur. Results indicate some tendency for signals to cluster during bear markets. There are no signals (based on winnowed data) since mid-January 2012.
Identification of these signals involves look-ahead bias, since identification of the lowest quintile requires knowing values across the entire sample period.
For more realistic signals, we look at real-time identification of low values of Rydex 2X/-2X.
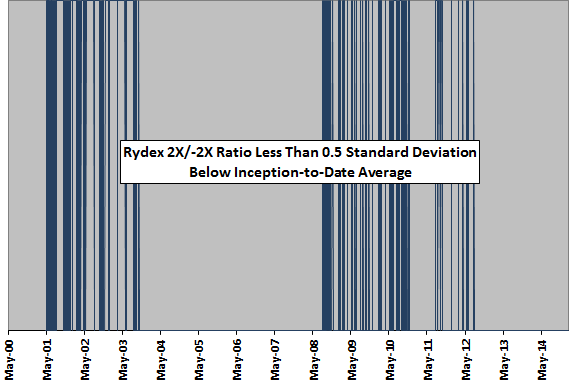
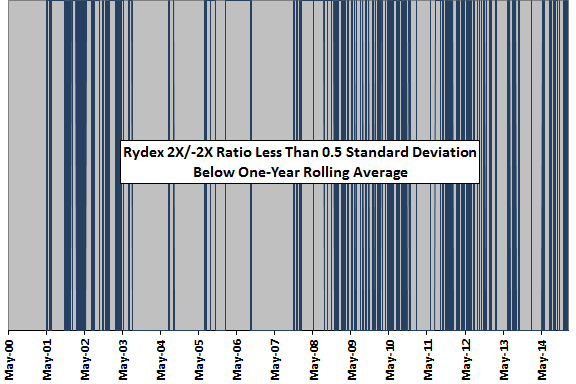
The final two charts use all daily data to identify instances when the value of Rydex 2X/-2X is below its average by at least 0.5 standard deviation. The upper chart uses inception-to-date data with signals commencing one year after inception of the funds. The lower chart uses a rolling window of one year.
Inception-to-date signals concentrate strongly after onsets of bear markets and during early bull markets. There are no signals between September 2003 and August 2008, or after August 2012. The average 10-day future S&P 500 Index return is -0.29% after these signals. This out-of-sample results is unattractive.
Rolling window signals are more dispersed. The average 10-day future S&P 500 Index return is -0.06% after these signals. This out-of-sample result is also unattractive.
In summary, evidence from simple tests offers little support for a belief that Rydex 2X/-2X is a useful indicator of future U.S. stock market returns.
Cautions regarding findings include:
- Other asset ratio metrics may generate different results. Experimentation with different ratios would introduce data snooping bias, such that the performance of the best metric would overstate expectations. The more experimentation, the greater the bias.
- As noted, the above analyses, except for the last two charts, are in-sample. An investor operating in real time could not have known the results.
- The above analyses ignore any frictions involved in signal exploitation.