Value Investing Strategy (Strategy Overview)
Momentum Investing Strategy (Strategy Overview)
Trading Calendar
Are there reliable patterns in cumulative return and daily return volatility of U.S. stocks across the calendar year, whether due to seasonal effects on human behavior, political cycles or tax considerations? To investigate, we construct cumulative return and daily return volatility profiles for the S&P 500 Index by trading day of the year. The year consists of trading days 0-249, with day 0 representing the closing price from the prior year. Although some years have 250-254 trading days, we do not include those days because some years do not. Also, we make adjustments for three anomalous years: (1) in 1968, we insert several dummy trading days with the same closing levels as immediately preceding days to avoid calendar misalignment because of unusual non-trading days; (2) in 2001, we insert four dummy trading days after 9/10/01 with the same closing level as 9/10/01 to avoid calendar misalignment for the balance of that year due to the interruption of market activity during September 2001; and, (3) in 2012, we insert two dummy trading days after 10/26/12 with the same closing level as 10/26/12 to avoid calendar misalignment for the balance of that year due to the interruption of market activity during Hurricane Sandy. Using daily closes of the S&P 500 Index since 1928, we find that:
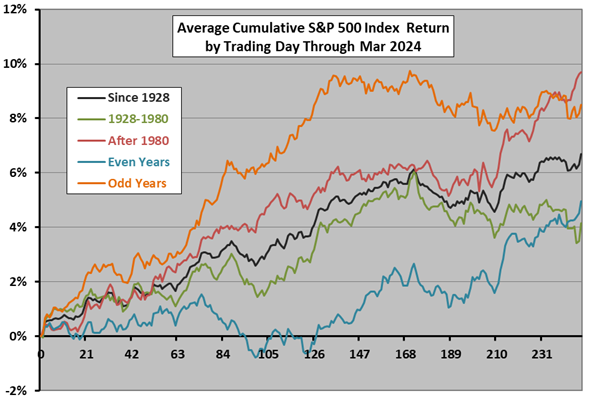
The following chart shows cumulative return profiles for the S&P 500 Index by trading day of the year:
- Since 1928
- For 1928 through 1980
- After 1980
- Even years since 1928 (national elections)
- Odd years since 1928 (no national elections)
Results support belief in three calendar-related phases for U.S. stock market returns, with the index tending to:
- Rise for roughly the first third of the year.
- Flatten for roughly the next six months.
- Lift off for the last two months of the year.
Differences between subperiods are slight, supporting belief in consistency of the pattern. Even years are substantially weaker than odd years, supporting belief that uncertainties associated with national elections discourage investors (with relief around election time).
For 1928-2023, the S&P 500 Index has finished in the black during 68% of years. For the first (second) half of the sample period, the index win rate is 60% (75%). For even (odd) years, the index win rate is 67% (69%).
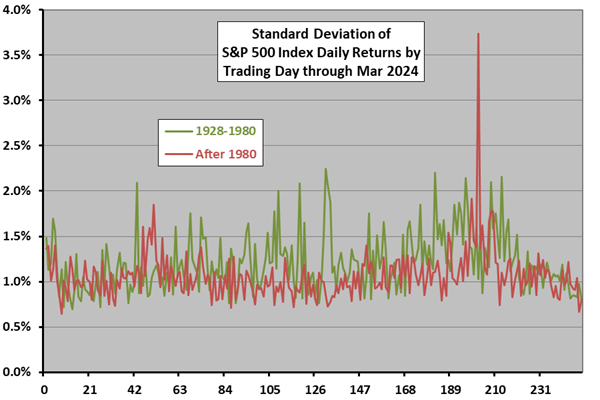
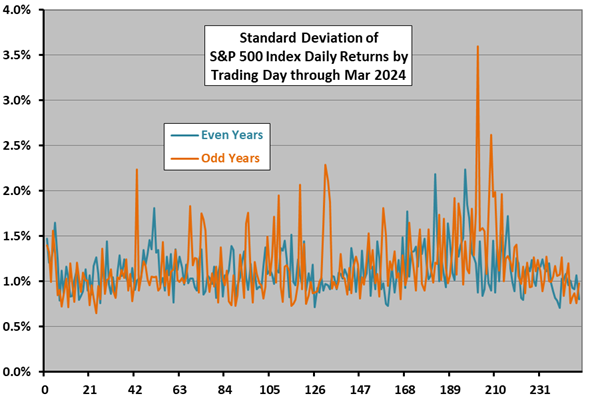
What about daily volatility?
The next two charts show daily volatility profiles for the S&P 500 Index by trading day of the year for two subperiods (upper chart) and for even and odd years (lower chart). The pronounced spike in both charts derives from the October 19, 1987 market crash.
Results suggest that U.S. stock market daily volatility:
- Tends to be relatively high during September-October.
- Is higher in the early subperiod.
In summary, evidence from simple tests supports beliefs that the U.S. stock market has three return regimes and two volatility regimes across the calendar year. Gains tend to come early and late as bookends for mid-year doldrums. National elections may drive volatility regimes.
We have applied the cumulative return approach for subsamples since 1990 to calculate the average month-to-date percentage change in the S&P 500 Index by trading day during the individual months of the year, all constructed to the same scale for comparability. For individual monthly profiles, see:
| January | February | March |
| April | May | June |
| July | August | September |
| October | November | December |
Cautions regarding findings include:
- Subsamples are small for reliable inference, especially if Black Swans confound.
- Results may differ for other equity markets and asset classes.
For a summary of research on calendar-related stock market behavior, see the Calendar Effects category.