Trading Calendar – November
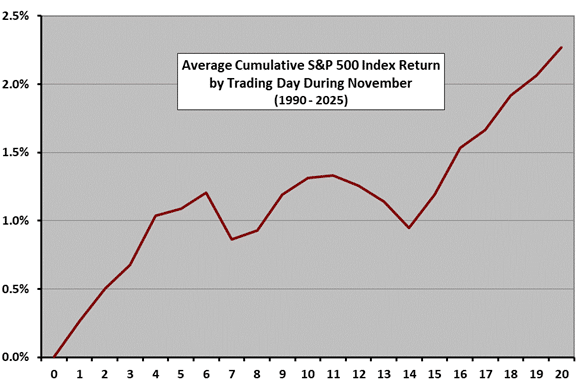
The following chart shows the average month-to-date percentage change in the S&P 500 index by trading day during November from 1990 through 2025. Day 0 represents the October close. It shows that the index during November tends to be positive, with some choppiness. We have not used data for trading day 21, because many Novembers do not have 21 trading days. Also, sample size is only 31-36 for specific trading days, so these results are only mildly suggestive rather than predictive. For 1990-2025, 27 Novembers have been winners and 9 losers. Election campaign relief in even-numbered years could be a factor in November’s positive average track record.
Return to the Trading Calendar to find other monthly profiles.