Guru Grades
 Can equity market experts, whether self-proclaimed or endorsed by others (such as publications), reliably provide stock market timing guidance? Do some experts clearly show better market timing intuition than others?
To investigate, during 2005 through 2012 we collected 6,582 forecasts for the U.S. stock market offered publicly by 68 experts, bulls and bears employing technical, fundamental and sentiment indicators. Collected forecasts include those in archives, such that the oldest forecast in the sample is from the end of 1998. For this final report, we have graded all these forecasts.
We assess forecasting acumen of stock market gurus as a group and rank them as individuals according to accuracy. The assessment of aggregate guru stock market forecasting performance is much more reliable, based on sample size and duration, than the evaluations of individuals.
We have performed completeness and integrity checks on the forecast grades, but some errors may remain.
Following the advice of experts is an investment technique. We intend this study as an aid to investors in learning mode regarding how much attention (and funds) this technique merits. This study is not a test of whether guru opinions and arguments are interesting, stimulating or useful in ways other than anticipating the behavior of the broad U.S. stock market. This kind of forecasting ability tested is different from, but may be related to, stock picking expertise.
Picking Gurus – Grading Methodology – Aggregate Results
Individual Results – Related Studies – Other Guru Reviews
Picking Gurus to Grade
We restricted reviews to publicly available forecasts for the U.S. stock market (freely available on the web). This approach: (1) avoids intellectual property issues; (2) when the forecast series is on the forecaster’s web site, inhibits manipulation because regular readers would likely notice changes/deletions/additions to the record; and, (3) inhibits mis-grading since anyone can verify forecast wording/context and contest grades. At this point, however, links to archives for some gurus are defunct.
We began selecting experts based on web searches for public archives with enough forecasts spanning enough market conditions to gauge accuracy. Readers subsequently helped identify additional gurus. A few individuals proposed themselves as gurus, but they generally lacked archive transparency per above and/or a long enough record for reasonable evaluations. A long enough record depends to a degree on the nature of forecasts. A relatively short sample period may be sufficient for weekly forecasts based principally on short-term technical conditions. A relatively long sample period may be necessary for forecasts emphasizing economic fundamentals. Rules of thumb are a minimum of about 20 reasonably independent forecasts spanning a minimum of about two years to encompass different market conditions.
The selected public records are sometimes on the web sites of the gurus themselves and sometimes on web sites of other parties (for example, the business media). Especially for the former, we looked for archives that are clearly dated and not retrospectively filtered (cherry-picked).
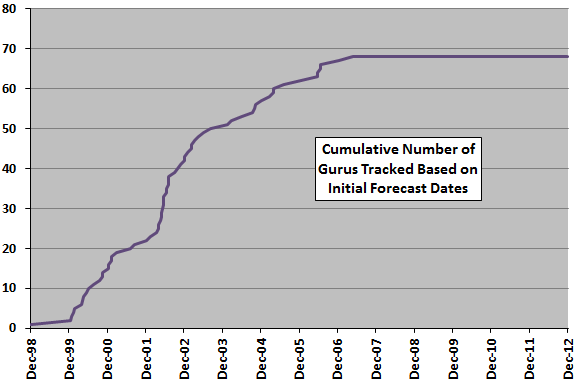
The following chart tracks the cumulative number of gurus tracked over time based on initial forecast dates. The number of gurus actively issuing forecasts is generally less than the cumulative total tracked, because some gurus stop forecasting (or media stop covering some gurus) over time.
Potential sources of bias in this approach include:
- There may be data availability bias in the overall sample, because some types of experts may be more likely to offer frequent public commentary than others.
- The media may tend to start quoting an expert after some dramatically correct forecast and stop after a series of incorrect forecasts (but it is not obvious that such attention bias affects long-term evaluations).
Grading Methodology
The essential grading methodology is to compare forecasts for the U.S. stock market (whether quantified or qualitative) to S&P 500 index returns over the future interval(s) most relevant to the forecast horizon. However, many forecasts contain ambiguities about degree and timing, equivocations and/or conditions. In general, we:
- Exclude forecasts that are too vague to grade and forecasts that include conditions requiring consideration of data other than stock market returns.
- Match the frequency of a guru’s commentaries (such as weekly or monthly) to the forecast horizon, unless the forecast specifies some other timing.
- Detrend forecasts by considering the long-run empirical behavior of the S&P 500 Index, which indicates that future returns over the next week, month, three months, six months and year are “normally” about 0.1%, 0.6%, 2%, 4% and 8%, respectively. For example, if a guru says investors should be bullish on U.S. stocks over the next six months, and the S&P 500 Index is up by only 1% over that interval, we would judge the call incorrect.
- Grade complex forecasts with elements proving both correct and incorrect as both right and wrong (not half right and half wrong).
Weaknesses in the methodology include:
- Some forecasts may be more important than others, but all are comparably weighted. In other words, measuring forecast accuracy is unlike measuring portfolio returns.
- Consecutive forecasts by a given guru often are not independent, in that the forecast publishing interval is shorter than the forecast horizon (suggesting that the guru repetitively uses similar information to generate forecasts). This serial correlation of forecasts effectively reduces sample size.
- In a few cases, for gurus with small samples, we include forecasts not explicitly tied to future stock market returns. There are not enough of these exceptions to affect aggregate findings.
- Grading vague forecasts requires judgment. Random judgment errors tend to cancel over time, but judgment biases could affect findings. Detailed grades are available via links below to individual guru records. Within those records are further links to source commentaries and articles (some links are defunct). Readers can therefore inspect forecast grades and (in many cases) forecast selection/context.
- S&P 500 Index return measurements for grading commence at the close on forecast publication dates, resulting in some looseness in grading because forecast publication may be before the open or after the close. Very few forecast grades are sensitive to a one-day return, and we try to take looseness into account in grading any forecasts that focus on the very short term.
Neither CXO Advisory Group LLC, nor any of its members personally, received any payments from the gurus graded. A few gurus offered access to private forecasts, but we either did not accept or did not utilize such access. Early in the project, we did solicit and use descriptions of market timing methods from three gurus with relatively high accuracies (see “Related Studies” below).
Aggregate Grading Results
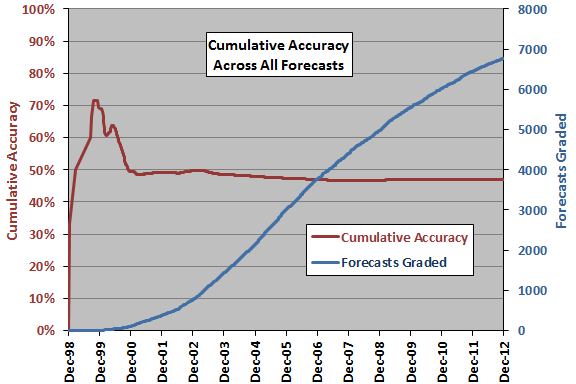
The following chart tracks the inception-to-date accuracy of all 6,582 graded forecasts in the sample. The extreme values early in the sample period relate to small cumulative samples. Terminal accuracy is 46.9%, an aggregate value very steady since the end of 2006. With respect to the gradual decline during 2003 through 2006:
- Grading judgment, as well as number of gurus and number of forecasts, may evolve with experience (becoming a little more strict).
- Individual guru samples may tend to have a lucky start, thereby attracting media attention or engendering self-confidence for publishing forecasts.
If we average by guru rather than across all forecasts, terminal accuracy is 47.4%.
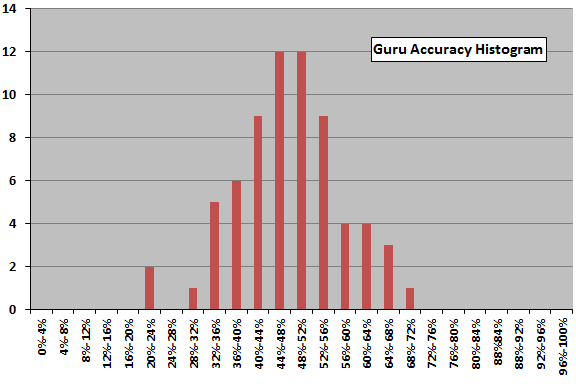
The next chart shows the distribution of the individual gurus accuracies for the entire sample. The distribution is roughly symmetric about the mean and may be normal, but 68 gurus (some with meager samples) is small for such analysis.
Why is the aggregate accuracy below 50%? Potential explanations include:
- There may be grading bias derived from some animus toward gurus.
- Sampled gurus may have motives other than accuracy in publishing forecasts. For example, gurus who make frequent public pronouncements may be those most prone to extreme forecasts to attract attention (and customers) by stimulating greed and fear. See “Why Gurus Go to Extremes” and “A Sign of All Times…”.
- There may be, on average across sampled gurus, a net trend following aspect that does not adequately account for mean reversion in stock market returns.
- The overall sample period may be sufficiently different from prior history that gurus anchored in older data may have persistently misjudged stock market behavior (see “Basic Equity Return Statistics”).
Individual Grading Results
The following table lists the gurus graded, along with associated number of forecasts graded and accuracy. Names link to individual guru descriptions and forecast records. Further links to the source forecast archives embedded in these records are in some cases defunct. It appears that a forecasting accuracy as high as 70% is quite rare.
Cautions regarding interpretation of accuracies include:
- Forecast samples for some gurus are small (especially in terms of forecasts formed on completely new information), limiting confidence in their estimated accuracies.
- Differences in forecast horizon may affect grades, with a long-range forecaster naturally tending to beat a short-range forecaster (see “Notes on Variability of Stock Market Returns”).
- Accuracies of different experts often cover different time frames according to the data available. An expert who is stuck on bullish (bearish) would tend to outperform in a rising (declining) stock market. This effect tends to cancel in aggregate.
- The private (for example, paid subscription) forecasts of gurus may be timelier and more accurate than the forecasts they are willing to offer publicly.
For a compilation of general objections and defenses made by guru’s under scrutiny, see “The Demon’s Defense”. For examples of specific objections and defenses, see:
- “Jim Cramer Comments on Our Evaluations of His Advice”
- “Martin Goldberg: Financial Sense?” and “Reclama from Martin Goldberg”
- “Reclama from Jason Kelly”
-
“Robert McHugh Objects to Our Evaluation of His Commentaries”
- “Reclama from Alan Newman”
- “Jim Rohrbach’s Disagreement with Review of His Technical Timing Approach”
- “Gary Savage, Tracking Smart Money?”
- “Reclama from Jack Schannep”
- “Nadeem Walayat’s Oraculations”
- “Reclama from Tim Wood”
Related Studies
For other analyses of Guru Grades project data, see:
- “Does Accurate Forecasting Get Attention?”
- “The Most Intriguing Gurus?”
- “Guru Stock Market Forecasting Accuracy Over Time”
- “Converging Guru Accuracies”
Both “The Annual Business Week Stock Market Forecasts” and “Blogger Sentiment Analysis” relate closely to the Guru Grades project. See also the “Investing Expertise” category for a stream of formal research on the forecasting and investing performance of experts, usually in aggregate. Some items in the “Individual Investing” category are also relevant.
Early in the Guru Grades project, we solicited explanations from three gurus with relatively high accuracies regarding how they approach stock market timing:
Other Guru Reviews
Sometimes, it is possible to measure actual (or hypothetical) investment performance, such as when a guru runs a publicly traded fund, clearly specifies an investing/trading methodology or publishes a meaningfully long archive of recommended trades. See, for example (embedded links to source data may be defunct):
- “Condor Options Newsletter Performance Review”
- “Review of Larry Connors’ Daily Battle Plan”
- Cramer Offers You His Protection? (for whom there is also a forecast accuracy)
- “Arch Crawford, Uncanny Acumen?”
- Robert Drach, Trading with 95% Confidence? (for whom there is also a forecast accuracy)
- Lenny Dykstra at Bat
- Stock Picking Performance of Fast Money Experts
- Forbes Evaluates Ken Fisher’s Stock Picking (for whom there is also a forecast accuracy)
- “Simple Tests of Sy Harding’s Seasonal Timing Strategy”
- The Timing Value of John Hussman’s Market Climate Assessments
- Testing Navellier’s Stock Picking and Market Timing Based on Fund Performance (for whom there is also a forecast accuracy)
- “Alan Newman’s Crosscurrents Stock Market Forecasts”
- “Tim Ord’s Intermediate-Term Market Calls”
- “Jim Rohrbach’s Technical Timing Approach”
- Steve Sarnoff’s Advice at the “Options Hotline”
- Analysis of James Stewart’s “Common Sense” Stock Market Timing Strategy (for whom there is also a forecast accuracy)
- “‘Strategy Lab’ Performance”
- “Timothy Sykes: Penny Stock Pump-and-Dump Detective?”
- “TimingCube Market Timing Advisory Service”
- Steve Todd’s Intermediate-Term Market Calls, A Forward Test
- Safe with Martin Weiss?
Sometimes there is not enough information to conduct any thorough review, with analyses limited to media searches and general questions such as those outlined in “Pandemonium?”. For example, see:
- “Doug Fabian: Still Successfully Investing?”
- “Norman Fosback’s Performance?”
- “Mark Skousen’s Claims So ‘Wild’ They Might Be True?”
- “How About James Stack?”
There are also a few items on gurus who do not espouse market timing, as follows: