A reader asked about Robert Drach’s “Basic Timing” Model Portfolio, initiated on 5/5/95 with the objective of demonstrating that market timing can beat the S&P 500 Index. The self-assessment of this portfolio (as of 8/19/09) reports 399 closed positions with an 89.7% win rate. The average closed position yields a 7.22% gain over 205 calendar days for an annualized return of 12.9%. The cumulative portfolio gain is 129%, compared to 93% for the S&P 500 Index. These cumulative returns “…are reflective as to capital capture and market price of current holdings… They do not include cash dividends, interest earned on cash balances, transaction costs, or anything else.” Robert Drach is publisher of the “Drach Weekly Research Report” (no web site). As explained in an article by Jon Markman, “he scales into stocks only when he believes there is a 95% likelihood of a successful result. …He focuses on buying only from a master list of 80 large stocks [with decent earnings predictability] that hasn’t changed much over the years.” Do Robert Drach’s results demonstrate market timing ability? We can address this question approximately by measuring the correlation of his cash balance (from the Cash Balance Ledger) with stock market returns. Using this cash balance data and contemporaneous S&P 500 Index data for the period 5/5/95-7/31/09 (171 months or about 14 years), we find that:
For a precise analysis of stock picking versus market timing, we should work with asset class (stocks, cash) portfolio weights rather than dollar amounts. However, the effort to reconstruct and mark this portfolio to market over a 14-year period is very large, so we use cash balance as an imperfect proxy for cash portfolio weight.
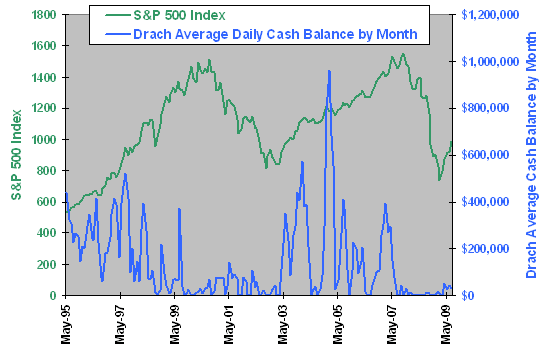
The following chart shows the average daily portfolio cash balance by month and the end-of-month S&P 500 index over the entire sample period. It is difficult to infer market timing from this chart, but there is some indication that Robert Drach’s model portfolio tends to hold more cash during bull markets than bear markets.
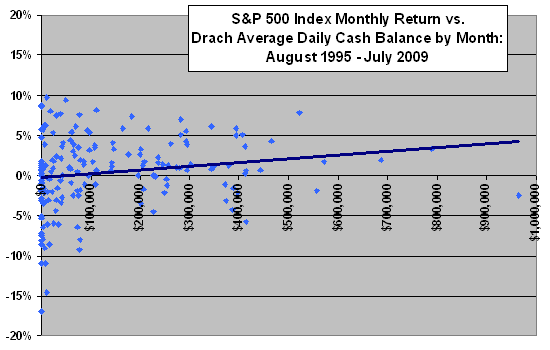
For greater precision, we relate the monthly S&P 500 Index return to average daily portfolio cash balance by month.

The following scatter plot relates the monthly S&P 500 Index return to the Drach model portfolio average daily cash balance during the same month from August 1995 through July 2009. We exclude the first three months of the overall sample period (May 1995-July 1995), because it appears that the cash balance during these months is high due to portfolio start-up. If portfolio timing is good, then the average daily cash balance by month should be systematically lower (higher) when the monthly S&P 500 Index return is stronger (weaker).
The chart shows, however, some tendency for cash to be higher (lower) when the stock market is stronger (weaker). In other words, the portfolio tends to be somewhat wrong-footed with respect to cash-stocks allocation at a monthly frequency.
For a broader perspective, we look at annual data.

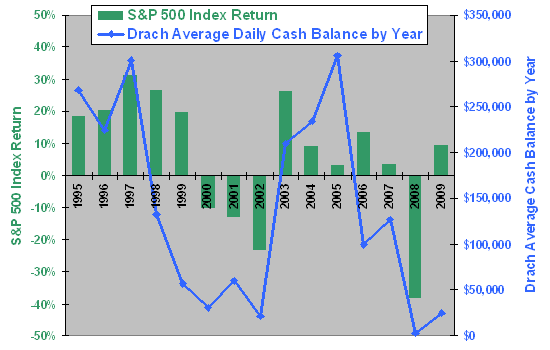
The next chart shows the annual return for the S&P 500 Index and the Drach model portfolio average daily cash balance by year during 1995-2009. Calculations for 1995 and 2009 are for partial years based on the 5/5/95 start date for the portfolio and 7/31/09 end date of this analysis. If portfolio timing is good, then the average daily cash balance by year should be systematically lower (higher) when the annual S&P 500 Index return is stronger (weaker).
In general, the portfolio appears to be too much in cash during the good market years (especially 1995-1997 and 2003) and too little in cash during the bad market years (especially 2000-2002 and 2008). Holding losers until they become winners (emphasis on a high percentage of winning trades) may explain the latter periods. When the market goes down, Robert Drach buys and his cash balance goes low. If the market falls further and stays down, he has no winners to sell and his cash balance stays stuck on low.

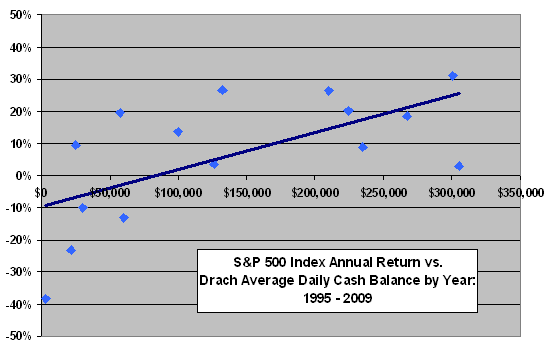
The following scatter plot built from the same data confirms a conclusion of poor timing at an annual frequency. The Drach model portfolio cash balance tends to be lower (higher) during years when the stock market is weak (strong), giving the portfolio higher exposure to bad market years than good market years.

A policy of holding stocks until they show a gain appears to be at least part of the reason that the Drach model portfolio has a high (~90%) win rate. However, 23 of his 24 Current Open Positions, with buy dates extending back as far as August 2000, are under water (many substantially).
While Robert Drach reports an apparently attractive annualized return on model portfolio closed trades of 12.9%, this return on invested capital does not include:
- The relatively much lower return on funds allocated to cash.
- The negative net return on the 24 open portfolio positions.
The compound annual growth rate for Robert Drach’s Basic Timing Model Portfolio during 5/5/95-8/19/09, assuming that dividends and return on cash offset trading frictions, is about 6.0%. The comparable annualized return for the S&P 500 Index over this period is about 4.7%, and the comparable annualized return for buying and holding the investable S&P Depository Receipts (SPY) with reinvestment of dividends is about 6.3%. It may be that Robert Drach’s stock picking tends to compensate for the adverse general market timing found above.
With an average holding period of 205 calendar days, taxes on the capital gains in Robert Drach’s model portfolio would substantially dent net returns.
In summary, evidence from simple tests using an imperfect metric indicates that Robert Drach’s approach to timing the broad U.S. stock market depresses rather than enhances portfolio returns. The aggregate performance of his “Basic Timing” Model Portfolio is roughly the same as that of buying and holding SPY.
For comparability with the methodology used in Guru Grades, we also collect a sample of Robert Drach’s U.S. stock market outlooks and assign subjective binary (right or wrong) grades to each forecast. The table below summarizes these forecasts and shows the performance of the S&P 500 Index over the 21, 63, 126 and 254 trading days after the publication date for each item. Red plus (minus) signs to the right of specific items indicate those that the market has subsequently proven right (wrong). Forecast sample is moderate, as is therefore confidence in the measurement of her accuracy.
See Guru Grades for a snapshot of the accuracies of various experts in predicting the behavior of the U.S. stock market, including links to detailed individual evaluations.
| S&P 500 Index | ||||||
| Date | Comments re: Robert Drach mostly via MSN Money andTheStreet.com | 21-Day Return | 63-Day Return | 126-Day Return | 254-Day Return | |
| 8/16/07 | ..two weeks ago…he recommended a 100% long position, and then after declines in the past week he raised his recommendation to 125% long and 150% long… …Drach’s…methodology is to buy…into these panics and then sell…after achieving a 10% to 20% gain in a short period of time… | 3.6% | 4.6% | 4.9% | -10.2% | + |
| 1/19/07 | It’s just a caution time. I’d love to be bullish like I was in — last July, but it’s time to take a little money off the table, I think. | 2.0% | 2.8% | 8.6% | -6.4% | – |
| 5/19/06 | Drach is heavily negative on the broad market…and does not expect to give an all-clear signal for several weeks, if not months. | -2.1% | 2.4% | 10.2% | 19.0% | + |
| 11/10/05 | Drach…forecast that the broad market will end positive this year because of a move largely contained within the final three weeks and will post a gain in the high single digits next year… | 2.4% | 2.9% | 4.9% | 13.2% | + |
| 4/20/05 | …he’s now pushed all of his chips in… | 4.7% | 8.1% | 4.6% | 15.0% | + |
| 4/6/05 | …last week, he began a process that took his accounts from 2% in stocks to 26% invested and now 50% invested. | -1.0% | 1.8% | 3.6% | 9.4% | + |
| 2/2/05 | The gruff veteran has moved from 98% negative at the start of the year to neutral this week, which means he’s on alert to start buying his short list of high-quality stocks if the market sinks more steeply in the next few weeks. | 2.4% | -2.7% | 4.3% | 6.0% | + |
| 11/8/04 | …almost totally in cash now, having only 3% invested in equities. | 1.5% | 3.2% | 1.2% | 4.8% | – |
| 8/24/04 | …remains mostly in cash (89% cash, 11% equities), awaiting a further pullback. | 1.1% | 6.8% | 8.0% | 10.6% | – |
| 1/28/04 | …investors chasing stocks today are ignoring a fence labeled Land Mines as they jump… | 1.5% | 0.9% | -2.9% | 4.7% | + |
| 10/1/03 | Drach is anticipating a 5% decline from here in high-quality Dow Industrials stocks, and a 7%-to-10% pullback in Nasdaq stocks into the middle of October… | 2.8% | 9.0% | 10.6% | 11.4% | – |
| 6/3/03 | As the market has ripped higher, Drach has gone more and more to cash, dropping down to an investment level of 18%. This is in contrast to his level at the March low, which reached 63%. So if the rally continues, he’ll miss a good chunk of it… | 2.3% | 3.8% | 8.9% | 15.5% | – |
| 5/6/03 | …scaled all the way back to 25% invested. | 6.0% | 5.2% | 12.4% | 17.6% | – |
| 4/30/03 | …his investment model had just turned negative — shifting to an exposure of 70% cash, 30% stocks. | 5.1% | 7.9% | 12.5% | 21.9% | – |
| 4/17/03 | …recently scaled back and now recommends an investment level of 40%. | 3.0% | 9.9% | 17.1% | 25.8% | – |
| 2/19/03 | Drach told his readers to move 63% of their money into stocks a week ago. He expects to move to 100% invested if prices decline back toward those lows in coming weeks. | 3.6% | 9.0% | 18.3% | 35.0% | + |
| 10/15/02 | Drach finally started buying in earnest a few weeks ago, and is now at the 84% invested level. | 0.1% | 5.7% | 1.1% | 17.9% | + |
| 7/8/02 | …currently 53% invested, up from 5% only a few weeks ago… | -12.0% | -16.2% | -7.0% | 1.2% | – |
| 6/12/02 | …only about 5% invested since early April and is still awaiting a signal to get back in. | -9.7% | -10.8% | -12.6% | -0.9% | + |