Objective research to aid investing decisions

Value Investing Strategy (Strategy Overview)

Allocations for March 2024 (Final)
Cash TLT LQD SPY

Momentum Investing Strategy (Strategy Overview)

Allocations for March 2024 (Final)
1st ETF 2nd ETF 3rd ETF

Team Management

June 27, 2023 • Posted in

[wlm_team_management]

Please or subscribe to continue reading...
Gain access to hundreds of premium articles, our momentum strategy, full RSS feeds, and more!  Learn more

RSS Weekly

March 22, 2019 • Posted in

Please or subscribe to continue reading...
Gain access to hundreds of premium articles, our momentum strategy, full RSS feeds, and more!  Learn more

Full RSS

February 5, 2019 • Posted in

Please or subscribe to continue reading...
Gain access to hundreds of premium articles, our momentum strategy, full RSS feeds, and more!  Learn more

Edit Profile

January 30, 2019 • Posted in

You must be logged in to edit your profile.

Subscription Information

For questions about your subscription, including cancellations, please contact support.

Please or subscribe to continue reading...
Gain access to hundreds of premium articles, our momentum strategy, full RSS feeds, and more!  Learn more

Combined Value-Momentum Strategy (SACEVS-SACEMS)

January 1, 2018 • Posted in

The Simple Asset Class ETF Value Strategy (SACEVS) seeks diversification across a small set of asset class exchange-traded funds (ETF) plus a monthly  tactical edge from timing term, credit and equity risk premiums. The two versions of SACEVS are: (1) most undervalued premium (Best Value) ; and, (2) weighting all undervalued premiums according to respective degree of undervaluation (Weighted).

The Simple Asset Class ETF Momentum Strategy (SACEMS) seeks diversification across asset classes via ETFs plus a monthly tactical edge from intermediate-term momentum. The three versions of SACEMS, all based on total ETF returns over recent months, are: (1) top one of nine ETFs (Top 1); (2) equally weighted top two (EW Top 2); and, (3) equally weighted top three (EW Top 3).

Based on feedback from subscribers about combinations of interest, we look at three equal-weighted (50-50) diversifying combinations of SACEVS and SACEMS, rebalanced monthly:

  1. 50-50 Best Value – EW Top 2: SACEVS Best Value paired with SACEMS Equally Weighted (EW) Top 2 (aggressive value and somewhat aggressive momentum).
  2. 50-50 Best Value – EW Top 3: SACEVS Best Value paired with SACEMS EW Top 3 (aggressive value and diversified momentum).
  3. 50-50 Weighted – EW Top 3: SACEVS Weighted paired with SACEMS EW Top 3 (diversified value and diversified momentum).

Supporting research includes (items may at times be unavailable for a few days during updates):

Some additional relevant but less directly applicable research is in the last list of items in “What Works Best?“.

Some investors may want to follow one of the 50-50 combined strategies. Others may want to modify the strategy with other than equal weights for SACEVS and SACEMS, as explored in “SACEMS-SACEVS for Value-Momentum Diversification”.

Cumulative Performance

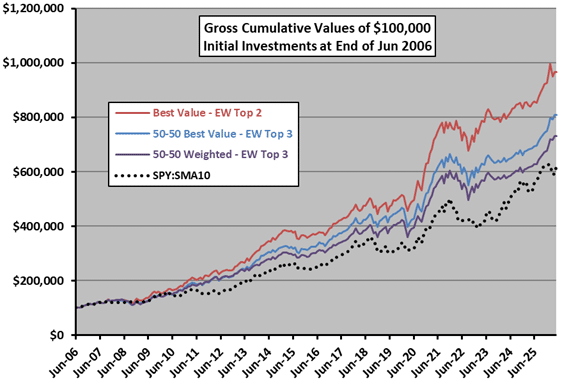
The following chart tracks gross cumulative values of $100,000 initial investments in each of the above three combination strategies since the end of June 2006. It includes as a benchmark a simple technical strategy (SPY:SMA10) that holds SPDR S&P 500 ETF Trust (SPY) when the S&P 500 Index is above its 10-month simple moving average and 3-month U.S. Treasury bills (Cash, or T-bills) when below. 

For perspective, we look at an array of performance metrics.

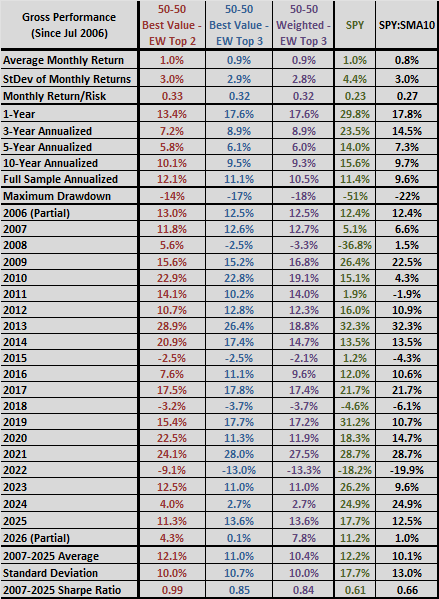
Performance Statistics

The following table summarizes annual/annualized returns for these three strategies, and for SPY and SPY:SMA10. Annualized returns are compound annual growth rates. Maximum drawdown is the deepest peak-to-trough drawdown for these strategies based on monthly measurements over the sample period. For Sharpe ratio, to calculate excess annual return, we use average monthly yield on 3-month Treasury bills during a year as the risk-free rate for that year.

Portfolio performance calculations are based on assumptions as summarized in Value Strategy and Momentum Strategy.

Something to keep in mind is that testing different SACEMS-SACEVS combinations and/or adjusting weights based on sensitivity tests incorporates data snooping bias, such that the best-performing combination overstates expectations.

Please or subscribe to continue reading...
Gain access to hundreds of premium articles, our momentum strategy, full RSS feeds, and more!  Learn more

CXO Strategies

June 21, 2017 • Posted in

Please or subscribe to continue reading...
Gain access to hundreds of premium articles, our momentum strategy, full RSS feeds, and more!  Learn more

Start Here

December 4, 2016 • Posted in

Please or subscribe to continue reading...
Gain access to hundreds of premium articles, our momentum strategy, full RSS feeds, and more!  Learn more

Simple Asset Class ETF Value Strategy (SACEVS)

March 27, 2015 • Posted in

Government securities, corporate bonds and equities arguably compete for investments at increasing levels of inherent risk based on: (1) valuations relative to each other, measured by risk premiums; and, (2) attractiveness of these risk premiums relative to their respective historical norms.

The Simple Asset Class ETF Value Strategy (SACEVS) seeks diversification across a small set of U.S. Treasury note, corporate bond and stock ETFs [iShares 20+ Year Treasury Bond (TLT), iShares iBoxx $ Investment Grade Corporate Bond (LQD) and SPDR S&P 500 (SPY)], plus a monthly tactical edge from timing the following three risk premiums associated with these asset classes:

  1. Term – monthly difference between the 10-year Constant Maturity U.S. Treasury note (T-note) yield and the 3-month Constant Maturity U.S. Treasury bill (T-bill) yield.
  2. Credit – monthly difference between the  Moody’s Seasoned Baa Corporate Bonds yield and the T-note yield.
  3. Equity – monthly difference between S&P 500 operating earnings yield and the T-note yield.

There are two versions of SACEVS: (1) Best Value, which at the end of each month picks the most undervalued premium (if any); and, (2) Weighted, which at the end of each month weights all undervalued premiums (if any) according to degree of undervaluation. Based on the assets considered, the principal benchmark is a monthly rebalanced portfolio of 60% SPY-40% TLT (60-40).

Supporting research includes (items may at times be unavailable for a few days during updates):

We started tracking SACEVS in 2015, with only slight adjustments since as documented in the above list.

Some investors may want to follow one of the two strategy alternatives tracked here. Others may want to adapt them with modifications suited to their individual goals and constraints. Still others may want to apply the analysis approaches to test other strategies. Something to keep in mind is that adding complexity to the strategy with refining variables/parameters increases the number of ways to optimize and thereby elevates potential for data snooping bias.

The next section summarizes historical (backtest) performance data.

Historical Performance

The following chart shows the gross cumulative values of $100,000 initial investments in the Best Value and Weighted portfolios since the end of July 2002 (when all ETFs considered are first available). The chart includes the 60-40 portfolio as a benchmark and buying and holding SPY for reference.

The following table summarizes some monthly statistics for these same strategies and their ETF components over the available sample period. Return/Risk is average return divided by standard deviation. Maximum (peak-to-trough) drawdowns are based on monthly measurements over the available sample period. 

The next table summarizes annual/annualized returns for these strategies over different intervals commonly used to describe performance of funds. The annualized returns are compound annual growth rates (CAGR). For Sharpe ratio, to calculate excess annual return, we use average monthly yield on 3-month Treasury bills during a year as the risk-free rate for that year.

The next section offers a discussion of this performance.

(more…)

Please or subscribe to continue reading...
Gain access to hundreds of premium articles, our momentum strategy, full RSS feeds, and more!  Learn more

Real Earnings Yield (REY) Model

January 17, 2015 • Posted in

Do investors require a predictably substantial expected stock market real earnings yield (aggregate expected corporate operating earnings minus the expected inflation over the next 12 months, divided by stock index level)? In other words, when the forward real earnings yield is relatively high (low), do they bid stock prices up (down) to restore a normal gap between forward earnings yield and expected inflation. To investigate whether such a Real Earnings Yield (REY) model works, we relate the combined evolution of an operating earnings forecast for the S&P 500 and an inflation forecast to the behavior of the S&P 500 Index. To convert from the quarterly earnings cycle to a monthly frequency, we assume 50% / 40% / 10% of new earnings data for a quarter becomes known during the first / second / third month after quarter end. Availability of S&P 500 lagged (trailing 12 month) operating earnings from Standard and Poor’s as an earnings forecast input limits the sample period. Using monthly earnings forecast and S&P 500 Index data during March 1989 through December 2014, we find that: (more…)

Please or subscribe to continue reading...
Gain access to hundreds of premium articles, our momentum strategy, full RSS feeds, and more!  Learn more

Reversion-to-Value (RTV) Model

January 17, 2015 • Posted in

Do investors require a predictably substantial expected stock market earnings yield (aggregate expected corporate operating earnings over the next 12 months divided by stock index level)? In other words, when the forward earnings yield is relatively high (low), do they bid stock prices up (down) to restore a normal expected yield. To investigate whether such a Reversion-to-Value (RTV) model works, we relate the evolution of an operating earnings forecast for the S&P 500 to the behavior of the S&P 500 Index. To convert from the quarterly earnings cycle to a monthly frequency, we assume 50% / 40% / 10% of new earnings data for a quarter becomes known during the first / second / third month after quarter end. Availability of S&P 500 lagged (trailing 12 month) operating earnings from Standard and Poor’s as an earnings forecast input limits the sample period. Using monthly earnings forecast and S&P 500 Index data during March 1989 through December 2014, we find that: (more…)

Please or subscribe to continue reading...
Gain access to hundreds of premium articles, our momentum strategy, full RSS feeds, and more!  Learn more

Daily Email Updates
Login
Questions?